

Chicken pot pie, frozen entree, prepared
Whole food · Meals, Entrees, and Side Dishes
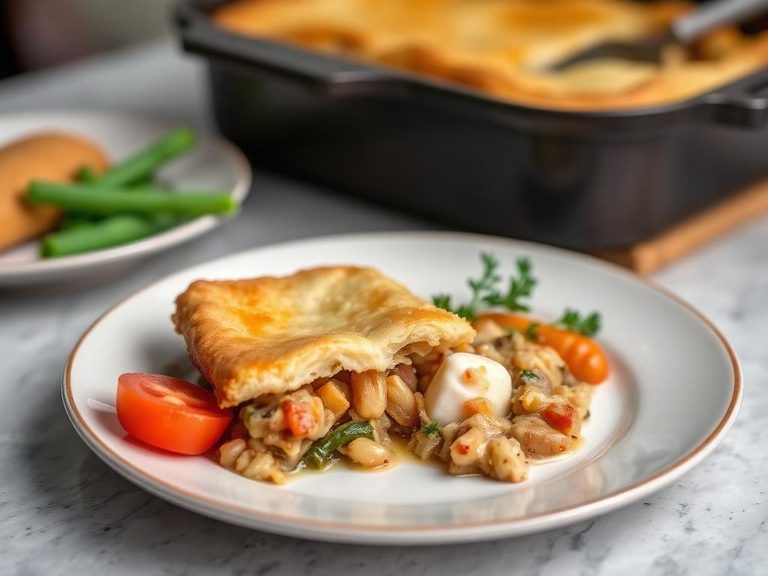
A classic comfort food, this frozen chicken pot pie features tender chunks of chicken and mixed vegetables (like peas, carrots, and potatoes) in a savory, creamy gravy, all encased in a flaky, buttery pastry crust. The nutrition profile is typical of a rich, indulgent meal, with a significant portion of its 204 kcal per 100g coming from fat and refined carbohydrates, offering a quick, satisfying source of energy.
Calorie split: 10% protein · 38% carbs · 52% fat
↓ Full nutrition💚 Why it's loved
People adore it for the ultimate comfort-food experience—the rich, savory gravy and flaky crust deliver a nostalgic, hearty flavor that feels like a warm hug. Its versatility as a standalone meal that requires minimal preparation makes it a beloved staple for busy weeknights.
⚠️ Watch-outs & how to enjoy it better
The high fat and refined carbohydrate content can lead to blood sugar spikes and may not suit low-fat or diabetic diets. To counteract this, pair a smaller portion with a large, leafy green salad to add volume and fiber, which helps slow digestion and improve satiety.
Key benefits
- Provides a complete, convenient meal with protein, carbs, and fat.
- Good source of quick energy from its carbohydrate content.
- Contains vegetables like peas and carrots for some vitamins and fiber.
- Offers high satiety due to its fat and protein content.
- A familiar, comforting option for a quick meal.
🍽️ Popular dishes
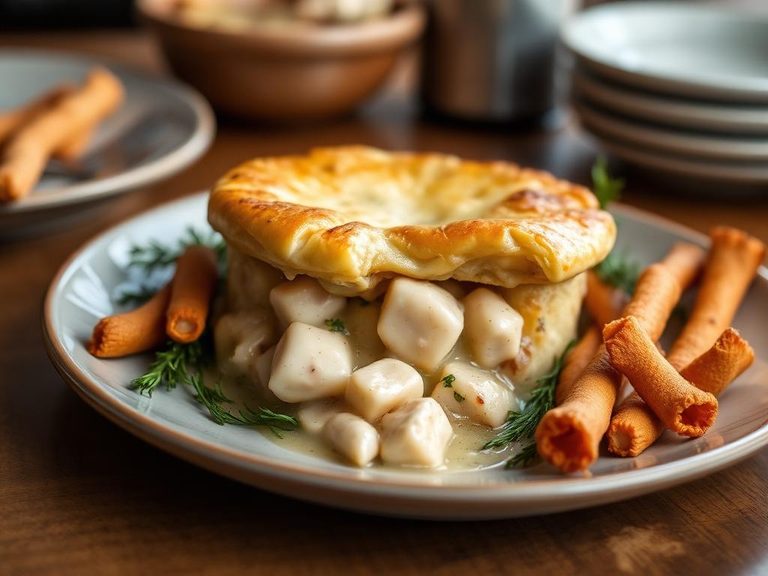
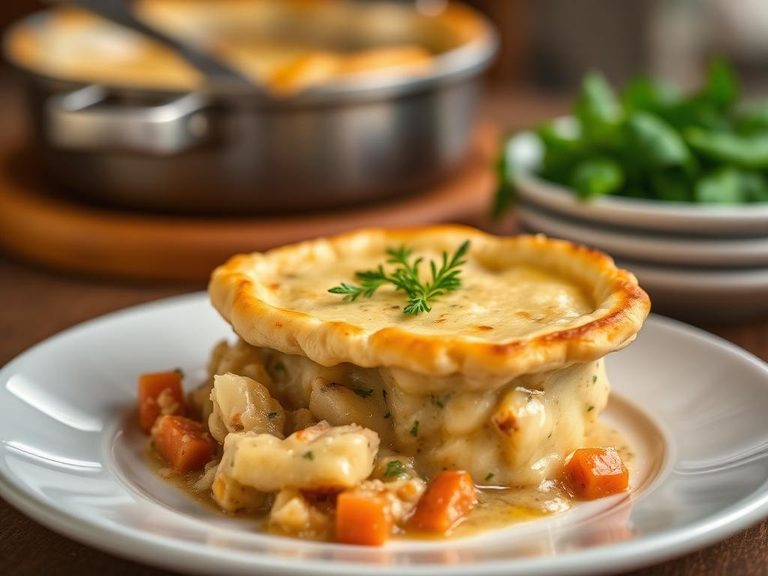
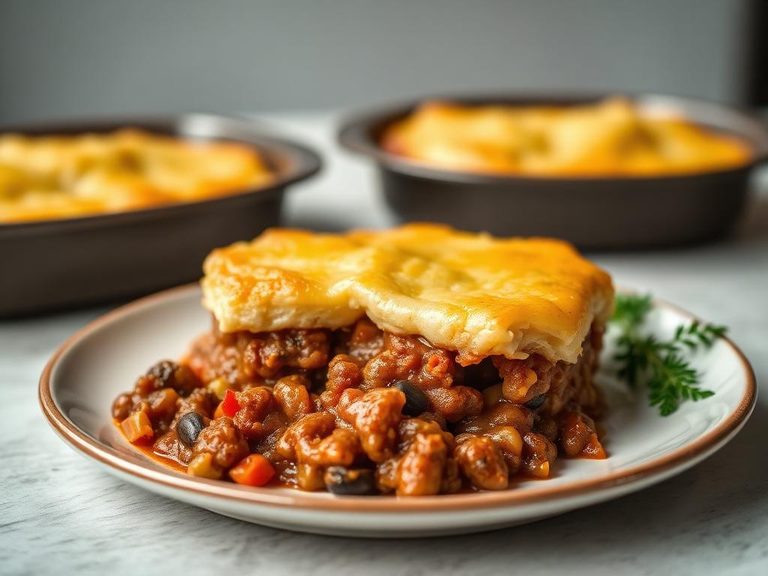
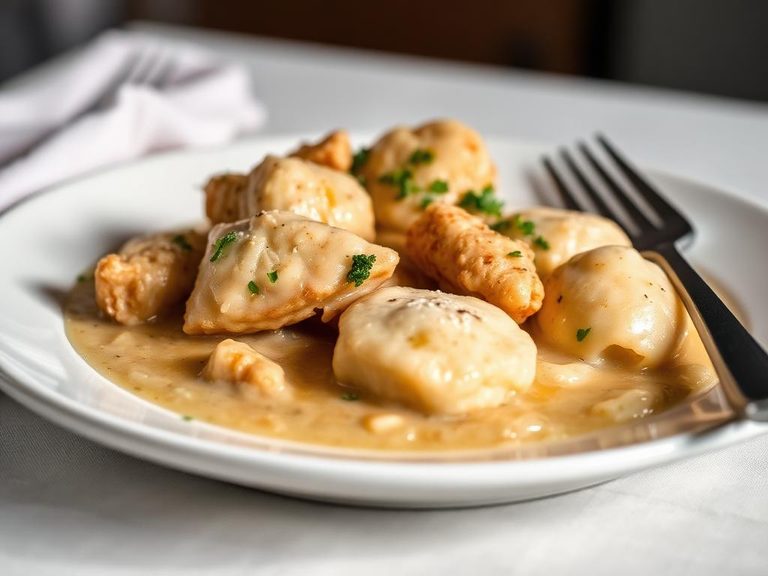
🌍 Where it's eaten
💡 Did you know?
The savory pie tradition dates back to ancient Greece and Rome, but the modern chicken pot pie as we know it is largely an American invention, popularized by frozen food brands in the mid-20th century.
Full nutrition (USDA data · scales with serving)
| Water | 62.6 g |
| Energy | 204 kcal |
| Energy | 853 kj |
| Protein | 5.1 g |
| Total lipid (fat) | 11.8 g |
| Ash | 1.3 g |
| Carbohydrate, by difference | 19.2 g |
| Fiber, total dietary | 1.1 g |
| Total Sugars | 2.3 g |
| Sucrose | 0.42 g |
| Glucose | 0.49 g |
| Fructose | 0.10 g |
| Lactose | 0.15 g |
| Maltose | 0.99 g |
| Galactose | 0.10 g |
| Starch | 14.3 g |
| Calcium, Ca | 20.0 mg |
| Iron, Fe | 0.76 mg |
| Magnesium, Mg | 11.0 mg |
| Phosphorus, P | 72.0 mg |
| Potassium, K | 110 mg |
| Sodium, Na | 393 mg |
| Zinc, Zn | 0.42 mg |
| Copper, Cu | 0.04 mg |
| Manganese, Mn | 0.19 mg |
| Selenium, Se | 5.4 ug |
| Vitamin C, total ascorbic acid | 1.0 mg |
| Thiamin | 0.10 mg |
| Riboflavin | 0.04 mg |
| Niacin | 1.9 mg |
| Pantothenic acid | 0.37 mg |
| Vitamin B-6 | 0.09 mg |
| Folate, total | 35.0 ug |
| Folic acid | 22.0 ug |
| Folate, food | 12.0 ug |
| Folate, DFE | 50.0 ug |
| Choline, total | 12.4 mg |
| Betaine | 12.7 mg |
| Vitamin B-12 | 0.11 ug |
| Vitamin B-12, added | 0.00 ug |
| Vitamin A, RAE | 34.0 ug |
| Retinol | 0.00 ug |
| Carotene, beta | 339 ug |
| Carotene, alpha | 132 ug |
| Cryptoxanthin, beta | 0.00 ug |
| Vitamin A, IU | 675 iu |
| Lycopene | 2.0 ug |
| Lutein + zeaxanthin | 90.0 ug |
| Vitamin E (alpha-tocopherol) | 0.53 mg |
| Vitamin E, added | 0.00 mg |
| Tocopherol, beta | 0.07 mg |
| Tocopherol, gamma | 2.1 mg |
| Tocopherol, delta | 0.76 mg |
| Tocotrienol, alpha | 0.04 mg |
| Tocotrienol, beta | 0.26 mg |
| Tocotrienol, gamma | 0.00 mg |
| Tocotrienol, delta | 0.00 mg |
| Vitamin D (D2 + D3), International Units | 2.0 iu |
| Vitamin D (D2 + D3) | 0.10 ug |
| Vitamin K (phylloquinone) | 10.7 ug |
| Vitamin K (Dihydrophylloquinone) | 5.1 ug |
| Vitamin K (Menaquinone-4) | 9.9 ug |
| Alcohol, ethyl | 0.00 g |
| Caffeine | 0.00 mg |
| Theobromine | 0.00 mg |
Fat & fatty acid profile (per 100g)
| Fatty acids, total saturated | 4.4 g |
| SFA 4:0 | 0.01 g |
| SFA 6:0 | 0.00 g |
| SFA 8:0 | 0.00 g |
| SFA 10:0 | 0.01 g |
| SFA 12:0 | 0.01 g |
| SFA 14:0 | 0.10 g |
| SFA 15:0 | 0.01 g |
| SFA 16:0 | 2.2 g |
| SFA 17:0 | 0.03 g |
| SFA 18:0 | 2.0 g |
| SFA 20:0 | 0.03 g |
| SFA 22:0 | 0.01 g |
| SFA 24:0 | 0.01 g |
| Fatty acids, total monounsaturated | 3.6 g |
| MUFA 14:1 | 0.01 g |
| MUFA 15:1 | 0.00 g |
| MUFA 16:1 | 0.21 g |
| MUFA 16:1 c | 0.20 g |
| MUFA 17:1 | 0.02 g |
| MUFA 18:1 | 3.3 g |
| MUFA 18:1 c | 3.3 g |
| MUFA 20:1 | 0.07 g |
| MUFA 22:1 | 0.01 g |
| MUFA 22:1 c | 0.00 g |
| MUFA 24:1 c | 0.00 g |
| Fatty acids, total polyunsaturated | 3.3 g |
| PUFA 18:2 | 3.0 g |
| PUFA 18:2 n-6 c,c | 2.9 g |
| PUFA 18:2 CLAs | 0.01 g |
| PUFA 18:3 | 0.25 g |
| PUFA 18:3 n-3 c,c,c (ALA) | 0.23 g |
| PUFA 18:3 n-6 c,c,c | 0.01 g |
| PUFA 18:4 | 0.00 g |
| PUFA 20:2 n-6 c,c | 0.03 g |
| PUFA 20:3 | 0.01 g |
| PUFA 20:3 n-3 | 0.00 g |
| PUFA 20:3 n-6 | 0.01 g |
| PUFA 20:4 | 0.02 g |
| PUFA 20:5 n-3 (EPA) | 0.00 g |
| PUFA 22:4 | 0.01 g |
| PUFA 22:5 n-3 (DPA) | 0.01 g |
| PUFA 22:6 n-3 (DHA) | 0.00 g |
| Fatty acids, total trans | 0.09 g |
| Fatty acids, total trans-monoenoic | 0.06 g |
| TFA 16:1 t | 0.00 g |
| TFA 18:1 t | 0.06 g |
| TFA 22:1 t | 0.00 g |
| TFA 18:2 t not further defined | 0.02 g |
| Fatty acids, total trans-polyenoic | 0.02 g |
| Cholesterol | 15.0 mg |
Amino acid profile (per 100g)
| Tryptophan | 0.07 g |
| Threonine | 0.21 g |
| Isoleucine | 0.22 g |
| Leucine | 0.42 g |
| Lysine | 0.31 g |
| Methionine | 0.10 g |
| Cystine | 0.09 g |
| Phenylalanine | 0.24 g |
| Tyrosine | 0.17 g |
| Valine | 0.25 g |
| Arginine | 0.31 g |
| Histidine | 0.17 g |
| Alanine | 0.27 g |
| Aspartic acid | 0.42 g |
| Glutamic acid | 1.3 g |
| Glycine | 0.24 g |
| Proline | 0.53 g |
| Serine | 0.24 g |
| Hydroxyproline | 0.02 g |
FAQ
Is frozen chicken pot pie a good source of protein?
It provides a moderate amount of protein (about 5g per 100g), but it's not a high-protein food. The primary nutritional contributors are fat and carbohydrates.
Why is the calorie count so high for its size?
The high calorie density comes from the fat-rich pastry crust and the creamy gravy, which are both calorie-dense components.
Can I make it healthier at home?
Yes. Use a whole-wheat crust, fill it with extra vegetables, use a lighter gravy made with broth and a small amount of cream or cornstarch, and choose lean chicken breast.
Nutrient density (calculated · NRF9.3)
Nutrient Rich Foods index: beneficial nutrients (protein, fiber, vitamins, minerals) minus saturated fat, added sugar & sodium, per 100 kcal.
NRF9.3 index — Fulgoni, Keast & Drewnowski, 2009. Computed from USDA nutrients.
Weight-loss friendliness (composite index)
Energy density 2.04 kcal/g · 10% calories from protein · 1.1 g fiber · 2.3 g sugar per 100 g.
Composite of energy density (Rolls et al., 1999), protein & fiber satiety, minus sugar. A calculated heuristic — ranks satiety-per-calorie, not a clinical measure.
Dietary load (calculated from USDA values)
Potential renal acid load. Positive = acid-forming, negative = alkaline-forming.
Sodium-to-potassium ratio: 3.57 (lower is better — aim for ≤ 1)
Sodium:potassium per WHO potassium guidance. Computed from USDA nutrients.