

Toaster pastries, fruit (includes apple, blueberry, cherry, strawberry)
Whole food · Baked Products

Photo: Wikipedia
A rectangular, pre-baked pastry pocket with a crumbly, shortbread-like crust and a sweet, gelled fruit filling. Its texture is a classic contrast between the dry, flaky exterior and the smooth, intensely sweet interior. Nutritionally, it is a high-energy, carbohydrate-dense food, with over 26g of sugar per 100g.
Calorie split: 4% protein · 73% carbs · 23% fat
↓ Full nutrition💚 Why it's loved
People love it for its powerful hit of sweet, nostalgic flavor and the satisfying textural contrast between the crust and filling. It's a cultural icon of convenience, often associated with childhood breakfasts or quick snacks.
⚠️ Watch-outs & how to enjoy it better
The high sugar content can lead to rapid blood-sugar spikes and subsequent crashes, offering little sustained energy. To counteract this, pair it with a source of protein or fat (like nuts or yogurt) to slow digestion, or opt for a half-portion. The refined flour and low fiber also contribute to its poor satiety.
Key benefits
- Provides quick, concentrated energy from carbohydrates
- Long shelf life makes it a convenient pantry staple
- Consistent, familiar flavor profile across brands
- Lightweight and portable for on-the-go consumption
🍽️ Popular dishes
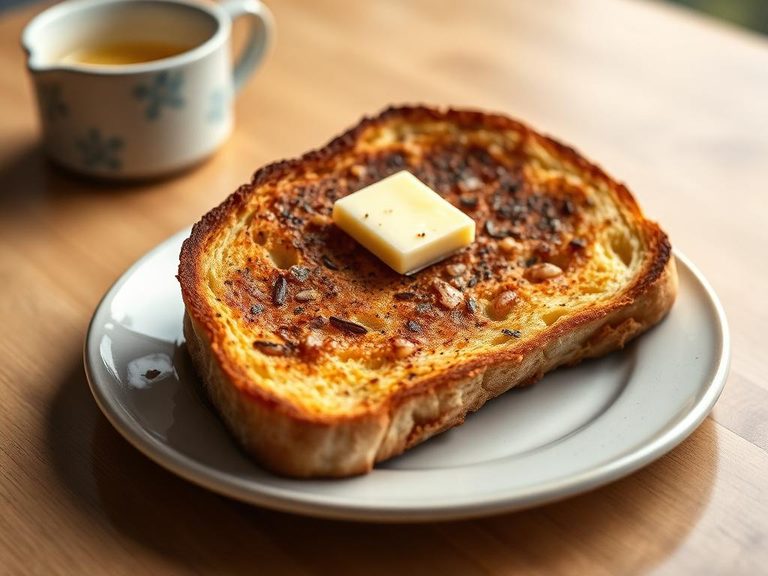



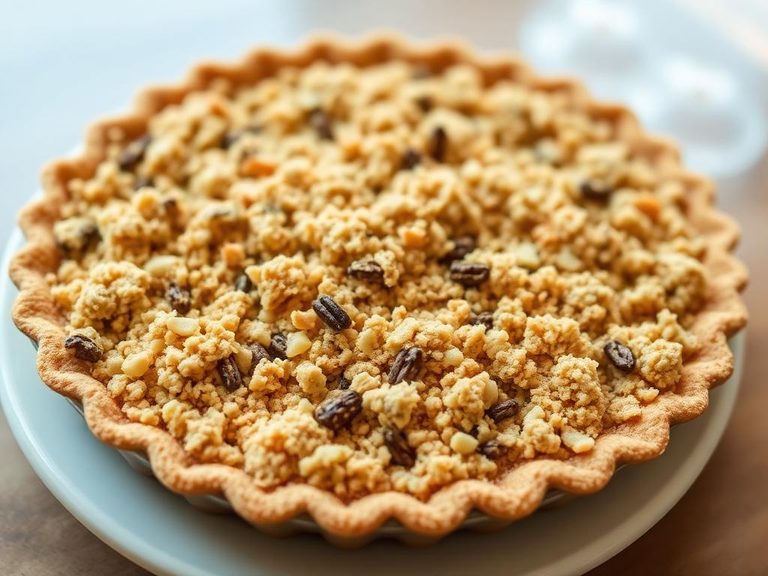
🌍 Where it's eaten
💡 Did you know?
The iconic frosted versions were a marketing innovation in the 1960s; the original unfrosted pastries were invented in the 1960s as a shelf-stable alternative to traditional pies.
Full nutrition (USDA data · scales with serving)
| Water | 14.3 g |
| Energy | 388 kcal |
| Energy | 1622 kj |
| Protein | 4.2 g |
| Total lipid (fat) | 9.9 g |
| Ash | 1.2 g |
| Carbohydrate, by difference | 70.3 g |
| Fiber, total dietary | 1.0 g |
| Total Sugars | 26.1 g |
| Sucrose | 1.8 g |
| Glucose | 15.2 g |
| Fructose | 4.4 g |
| Lactose | 0.72 g |
| Maltose | 4.0 g |
| Galactose | 0.00 g |
| Starch | 33.0 g |
| Calcium, Ca | 16.0 mg |
| Iron, Fe | 5.5 mg |
| Magnesium, Mg | 12.0 mg |
| Phosphorus, P | 87.0 mg |
| Potassium, K | 102 mg |
| Sodium, Na | 334 mg |
| Zinc, Zn | 0.38 mg |
| Copper, Cu | 0.07 mg |
| Manganese, Mn | 0.32 mg |
| Selenium, Se | 3.1 ug |
| Vitamin C, total ascorbic acid | 0.00 mg |
| Thiamin | 0.65 mg |
| Riboflavin | 0.56 mg |
| Niacin | 6.8 mg |
| Pantothenic acid | 0.27 mg |
| Vitamin B-6 | 0.52 mg |
| Folate, total | 111 ug |
| Folic acid | 91.0 ug |
| Folate, food | 20.0 ug |
| Folate, DFE | 174 ug |
| Choline, total | 6.4 mg |
| Vitamin B-12 | 0.00 ug |
| Vitamin B-12, added | 0.00 ug |
| Vitamin A, RAE | 202 ug |
| Retinol | 202 ug |
| Carotene, beta | 3.0 ug |
| Carotene, alpha | 3.0 ug |
| Cryptoxanthin, beta | 3.0 ug |
| Vitamin A, IU | 680 iu |
| Lycopene | 0.00 ug |
| Lutein + zeaxanthin | 52.0 ug |
| Vitamin E (alpha-tocopherol) | 0.90 mg |
| Vitamin E, added | 0.00 mg |
| Tocopherol, beta | 0.19 mg |
| Tocopherol, gamma | 3.3 mg |
| Tocopherol, delta | 1.3 mg |
| Tocotrienol, alpha | 0.16 mg |
| Tocotrienol, beta | 0.58 mg |
| Tocotrienol, gamma | 0.25 mg |
| Tocotrienol, delta | 0.00 mg |
| Vitamin D (D2 + D3), International Units | 0.00 iu |
| Vitamin D (D2 + D3) | 0.00 ug |
| Vitamin K (phylloquinone) | 15.4 ug |
| Vitamin K (Dihydrophylloquinone) | 0.00 ug |
| Vitamin K (Menaquinone-4) | 0.00 ug |
| Alcohol, ethyl | 0.00 g |
| Caffeine | 0.00 mg |
| Theobromine | 0.00 mg |
Fat & fatty acid profile (per 100g)
| Fatty acids, total saturated | 3.6 g |
| SFA 4:0 | 0.00 g |
| SFA 6:0 | 0.00 g |
| SFA 8:0 | 0.00 g |
| SFA 10:0 | 0.02 g |
| SFA 12:0 | 0.01 g |
| SFA 14:0 | 0.06 g |
| SFA 15:0 | 0.01 g |
| SFA 16:0 | 3.0 g |
| SFA 17:0 | 0.01 g |
| SFA 18:0 | 0.43 g |
| SFA 20:0 | 0.03 g |
| SFA 22:0 | 0.02 g |
| SFA 24:0 | 0.01 g |
| Fatty acids, total monounsaturated | 2.7 g |
| MUFA 14:1 | 0.00 g |
| MUFA 15:1 | 0.00 g |
| MUFA 16:1 | 0.01 g |
| MUFA 16:1 c | 0.01 g |
| MUFA 17:1 | 0.00 g |
| MUFA 18:1 | 2.7 g |
| MUFA 18:1 c | 2.7 g |
| MUFA 20:1 | 0.02 g |
| MUFA 22:1 | 0.00 g |
| MUFA 22:1 c | 0.00 g |
| MUFA 24:1 c | 0.00 g |
| Fatty acids, total polyunsaturated | 3.2 g |
| PUFA 18:2 | 2.9 g |
| PUFA 18:2 n-6 c,c | 2.9 g |
| PUFA 18:2 CLAs | 0.01 g |
| PUFA 18:3 | 0.33 g |
| PUFA 18:3 n-3 c,c,c (ALA) | 0.31 g |
| PUFA 18:3 n-6 c,c,c | 0.01 g |
| PUFA 18:3i | 0.00 g |
| PUFA 18:4 | 0.00 g |
| PUFA 20:2 n-6 c,c | 0.00 g |
| PUFA 20:3 | 0.00 g |
| PUFA 20:3 n-3 | 0.00 g |
| PUFA 20:3 n-6 | 0.00 g |
| PUFA 20:4 | 0.00 g |
| PUFA 20:5 n-3 (EPA) | 0.00 g |
| PUFA 22:4 | 0.00 g |
| PUFA 22:5 n-3 (DPA) | 0.00 g |
| PUFA 22:6 n-3 (DHA) | 0.00 g |
| Fatty acids, total trans | 0.03 g |
| Fatty acids, total trans-monoenoic | 0.01 g |
| TFA 16:1 t | 0.00 g |
| TFA 18:1 t | 0.01 g |
| TFA 22:1 t | 0.00 g |
| TFA 18:2 t not further defined | 0.02 g |
| Fatty acids, total trans-polyenoic | 0.02 g |
| Cholesterol | 0.00 mg |
Amino acid profile (per 100g)
Estimated from Toaster Pastries, fruit, frosted (include apples, blueberry, cherry, strawberry) — USDA does not publish this profile for Toaster pastries.
| Tryptophan | 0.07 g |
| Threonine | 0.10 g |
| Isoleucine | 0.13 g |
| Leucine | 0.28 g |
| Lysine | 0.14 g |
| Methionine | 0.07 g |
| Cystine | 0.10 g |
| Phenylalanine | 0.17 g |
| Tyrosine | 0.09 g |
| Valine | 0.15 g |
| Arginine | 0.13 g |
| Histidine | 0.07 g |
| Alanine | 0.12 g |
| Aspartic acid | 0.29 g |
| Glutamic acid | 1.4 g |
| Glycine | 0.15 g |
| Proline | 0.32 g |
| Serine | 0.23 g |
| Hydroxyproline | 0.00 g |
FAQ
Why is the pastry so dry?
The low moisture content is intentional for shelf stability. It's designed to be toasted, which warms the filling and slightly softens the crust, improving the texture and flavor.
Is it a breakfast food or a dessert?
It's culturally positioned as a quick breakfast item, but its high sugar and fat content aligns more with a dessert or occasional treat nutritionally.
How does it compare nutritionally to a slice of pie?
Per 100g, it is generally higher in sugar and lower in fiber than a typical fruit pie, as it contains less actual fruit and more concentrated sugar and refined flour.
Nutrient density (calculated · NRF9.3)
Nutrient Rich Foods index: beneficial nutrients (protein, fiber, vitamins, minerals) minus saturated fat, added sugar & sodium, per 100 kcal.
NRF9.3 index — Fulgoni, Keast & Drewnowski, 2009. Computed from USDA nutrients.
Weight-loss friendliness (composite index)
Energy density 3.88 kcal/g · 4% calories from protein · 1.0 g fiber · 26.1 g sugar per 100 g.
Composite of energy density (Rolls et al., 1999), protein & fiber satiety, minus sugar. A calculated heuristic — ranks satiety-per-calorie, not a clinical measure.
Dietary load (calculated from USDA values)
Potential renal acid load. Positive = acid-forming, negative = alkaline-forming.
Sodium-to-potassium ratio: 3.27 (lower is better — aim for ≤ 1)
Sodium:potassium per WHO potassium guidance. Computed from USDA nutrients.