

Crustaceans, shrimp, mixed species, cooked, moist heat (may contain additives to retain moisture)
Whole food · Finfish and Shellfish Products
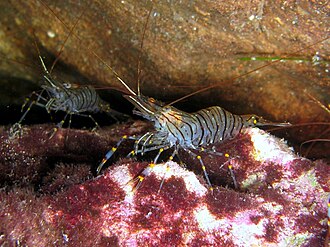
Photo: Wikipedia
Succulent shrimp, cooked via moist heat methods like steaming or boiling, offers a tender, slightly firm texture with a sweet, briny flavor. This lean protein powerhouse delivers a massive 22.78g of protein per 100g with minimal fat and carbs, making it a staple for high-protein, low-calorie diets.
Calorie split: 81% protein · 5% carbs · 14% fat
↓ Full nutrition💚 Why it's loved
People adore shrimp for its quick cooking time, versatile mild sweetness that absorbs sauces and spices beautifully, and its satisfying, snappy texture that elevates everything from simple salads to elaborate curries.
⚠️ Watch-outs & how to enjoy it better
Shrimp is a common shellfish allergen and can be high in sodium, especially if pre-treated with brine or preservatives. To mitigate, choose fresh or frozen shrimp without sodium additives, rinse before cooking, and pair with potassium-rich vegetables like spinach or avocado to balance electrolytes.
Key benefits
- Exceptionally high in lean protein for muscle maintenance and satiety
- Very low in calories (119 kcal per 100g)
- Good source of selenium, an important antioxidant mineral
- Contains astaxanthin, a natural antioxidant pigment
- Naturally low in carbohydrates and sugar
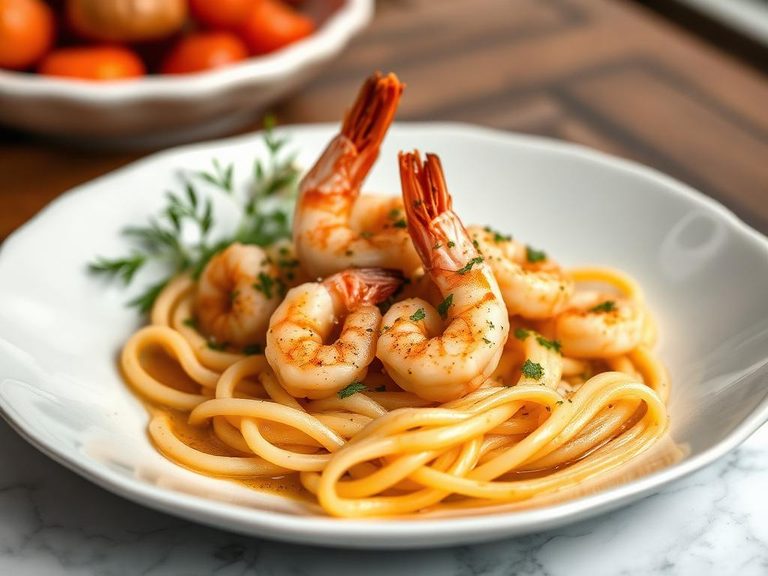
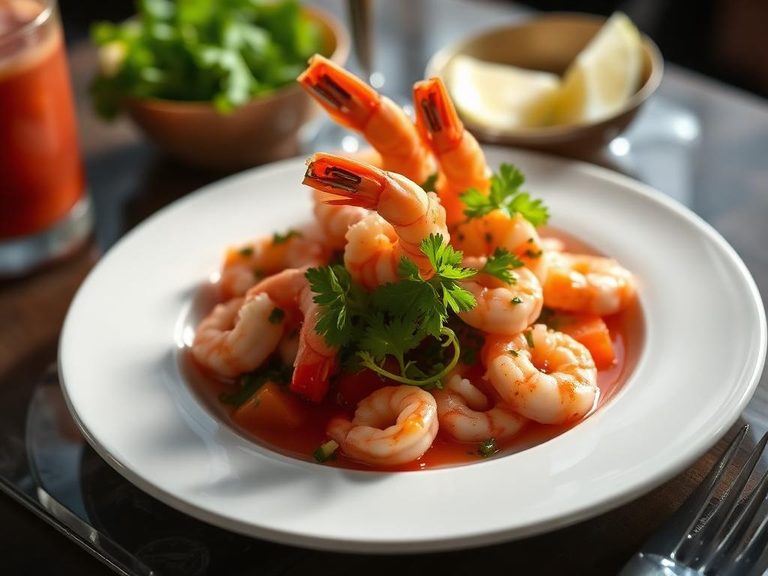
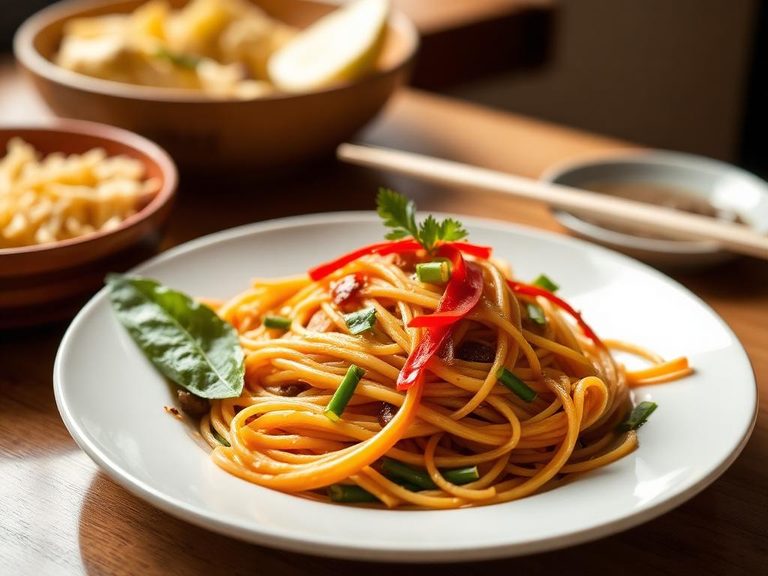
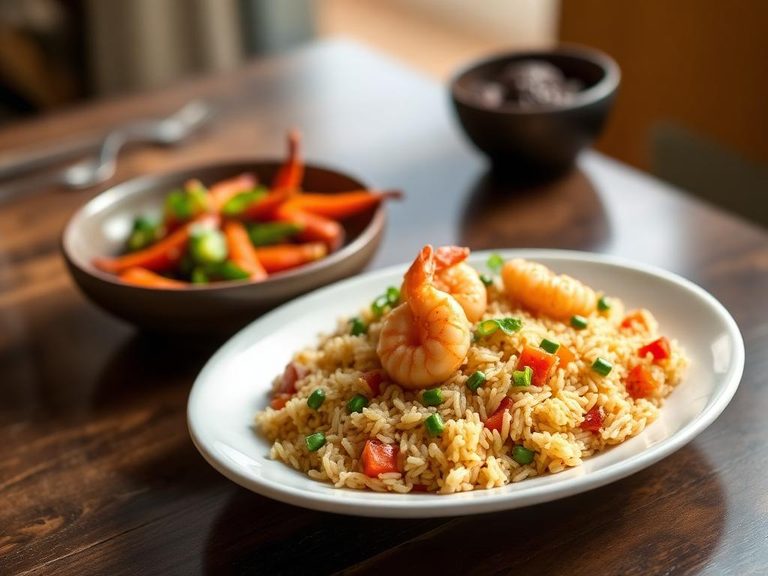
🍽️ Popular dishes
🌍 Where it's eaten
💡 Did you know?
Shrimp are sometimes called 'the cockroaches of the sea' due to their scavenging habits, but this is a culinary misnomer; most commercially farmed shrimp are raised in controlled, clean-water environments.
Full nutrition (USDA data · scales with serving)
| Water | 71.6 g |
| Energy | 119 kcal |
| Energy | 497 kj |
| Protein | 22.8 g |
| Total lipid (fat) | 1.7 g |
| Ash | 3.1 g |
| Carbohydrate, by difference | 1.5 g |
| Fiber, total dietary | 0.00 g |
| Total Sugars | 0.00 g |
| Sucrose | 0.00 g |
| Glucose | 0.00 g |
| Fructose | 0.00 g |
| Lactose | 0.00 g |
| Maltose | 0.00 g |
| Galactose | 0.00 g |
| Starch | 0.00 g |
| Calcium, Ca | 91.0 mg |
| Iron, Fe | 0.32 mg |
| Magnesium, Mg | 37.0 mg |
| Phosphorus, P | 306 mg |
| Potassium, K | 170 mg |
| Sodium, Na | 947 mg |
| Zinc, Zn | 1.6 mg |
| Copper, Cu | 0.26 mg |
| Manganese, Mn | 0.05 mg |
| Selenium, Se | 49.5 ug |
| Vitamin C, total ascorbic acid | 0.00 mg |
| Thiamin | 0.03 mg |
| Riboflavin | 0.02 mg |
| Niacin | 2.7 mg |
| Pantothenic acid | 0.52 mg |
| Vitamin B-6 | 0.24 mg |
| Folate, total | 24.0 ug |
| Folic acid | 0.00 ug |
| Folate, food | 24.0 ug |
| Folate, DFE | 24.0 ug |
| Choline, total | 135 mg |
| Vitamin B-12 | 1.7 ug |
| Vitamin B-12, added | 0.00 ug |
| Vitamin A, RAE | 90.0 ug |
| Retinol | 90.0 ug |
| Carotene, beta | 0.00 ug |
| Carotene, alpha | 0.00 ug |
| Cryptoxanthin, beta | 0.00 ug |
| Vitamin A, IU | 301 iu |
| Lycopene | 0.00 ug |
| Lutein + zeaxanthin | 0.00 ug |
| Vitamin E (alpha-tocopherol) | 2.2 mg |
| Vitamin E, added | 0.00 mg |
| Tocopherol, beta | 0.00 mg |
| Tocopherol, gamma | 0.20 mg |
| Tocopherol, delta | 0.05 mg |
| Tocotrienol, alpha | 0.00 mg |
| Tocotrienol, beta | 0.00 mg |
| Tocotrienol, gamma | 0.00 mg |
| Tocotrienol, delta | 0.00 mg |
| Vitamin D (D2 + D3), International Units | 4.0 iu |
| Vitamin D (D2 + D3) | 0.10 ug |
| Vitamin D3 (cholecalciferol) | 0.10 ug |
| Vitamin K (phylloquinone) | 0.40 ug |
| Vitamin K (Dihydrophylloquinone) | 0.00 ug |
| Vitamin K (Menaquinone-4) | 0.40 ug |
| Alcohol, ethyl | 0.00 g |
| Caffeine | 0.00 mg |
| Theobromine | 0.00 mg |
Fat & fatty acid profile (per 100g)
| Fatty acids, total saturated | 0.52 g |
| SFA 4:0 | 0.00 g |
| SFA 6:0 | 0.00 g |
| SFA 8:0 | 0.00 g |
| SFA 10:0 | 0.00 g |
| SFA 12:0 | 0.01 g |
| SFA 14:0 | 0.02 g |
| SFA 15:0 | 0.01 g |
| SFA 16:0 | 0.28 g |
| SFA 17:0 | 0.02 g |
| SFA 18:0 | 0.16 g |
| SFA 20:0 | 0.00 g |
| SFA 22:0 | 0.00 g |
| SFA 24:0 | 0.01 g |
| Fatty acids, total monounsaturated | 0.36 g |
| MUFA 14:1 | 0.00 g |
| MUFA 15:1 | 0.00 g |
| MUFA 16:1 | 0.04 g |
| MUFA 17:1 | 0.09 g |
| MUFA 18:1 | 0.22 g |
| MUFA 20:1 | 0.01 g |
| MUFA 22:1 | 0.00 g |
| MUFA 24:1 c | 0.00 g |
| Fatty acids, total polyunsaturated | 0.59 g |
| PUFA 18:2 | 0.19 g |
| PUFA 18:3 | 0.01 g |
| PUFA 18:4 | 0.00 g |
| PUFA 20:2 n-6 c,c | 0.01 g |
| PUFA 20:3 | 0.01 g |
| PUFA 20:4 | 0.07 g |
| PUFA 20:5 n-3 (EPA) | 0.14 g |
| PUFA 22:4 | 0.01 g |
| PUFA 22:5 n-3 (DPA) | 0.01 g |
| PUFA 22:6 n-3 (DHA) | 0.14 g |
| Fatty acids, total trans | 0.04 g |
| Cholesterol | 211 mg |
Amino acid profile (per 100g)
| Tryptophan | 0.26 g |
| Threonine | 0.90 g |
| Isoleucine | 1.1 g |
| Leucine | 1.9 g |
| Lysine | 2.2 g |
| Methionine | 0.67 g |
| Cystine | 0.27 g |
| Phenylalanine | 0.99 g |
| Tyrosine | 0.86 g |
| Valine | 1.1 g |
| Arginine | 2.2 g |
| Histidine | 0.50 g |
| Alanine | 1.4 g |
| Aspartic acid | 2.5 g |
| Glutamic acid | 4.0 g |
| Glycine | 1.3 g |
| Proline | 1.0 g |
| Serine | 0.93 g |
FAQ
Is the 'may contain additives to retain moisture' a concern?
Some frozen shrimp are treated with sodium tripolyphosphate (STPP) to retain water. This adds sodium and can slightly increase weight. Look for 'dry' or 'chemical-free' shrimp, or rinse thoroughly to reduce surface additives.
How does the nutrition compare to other seafood?
Shrimp is one of the leanest, highest-protein seafood options, with significantly less fat than salmon or mackerel, and fewer calories than most white fish per 100g serving.
Can I eat shrimp on a low-cholesterol diet?
While shrimp contains dietary cholesterol, modern research suggests dietary cholesterol has a smaller impact on blood cholesterol for most people than saturated fat. Its low saturated fat content makes it a reasonable choice in moderation.
Nutrient density (calculated · NRF9.3)
Nutrient Rich Foods index: beneficial nutrients (protein, fiber, vitamins, minerals) minus saturated fat, added sugar & sodium, per 100 kcal.
NRF9.3 index — Fulgoni, Keast & Drewnowski, 2009. Computed from USDA nutrients.
Weight-loss friendliness (composite index)
Energy density 1.19 kcal/g · 77% calories from protein · 0.0 g fiber · 0.0 g sugar per 100 g.
Composite of energy density (Rolls et al., 1999), protein & fiber satiety, minus sugar. A calculated heuristic — ranks satiety-per-calorie, not a clinical measure.
Dietary load (calculated from USDA values)
Potential renal acid load. Positive = acid-forming, negative = alkaline-forming.
Sodium-to-potassium ratio: 5.57 (lower is better — aim for ≤ 1)
Sodium:potassium per WHO potassium guidance. Computed from USDA nutrients.