

Turkey, retail parts, thigh, meat only, cooked, roasted
Whole food · Poultry Products
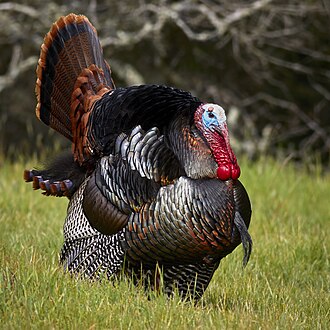
Photo: Wikipedia
Roasted turkey thigh meat is a rich, savory protein source with a deep, slightly gamier flavor and a tender, moist texture compared to breast meat. It boasts an impressive 25.14 grams of protein per 100g with minimal fat and virtually no carbohydrates, making it a lean powerhouse. Its dark meat character provides a satisfying, hearty bite that holds up well to roasting and braising.
Calorie split: 63% protein · 1% carbs · 35% fat
↓ Full nutrition💚 Why it's loved
People love roasted turkey thigh for its robust, savory flavor and juicy texture that remains tender even when cooked thoroughly. It's a versatile protein that anchors holiday meals and weeknight dinners alike, offering a satisfying alternative to chicken with a richer taste profile.
⚠️ Watch-outs & how to enjoy it better
Some find turkey thigh meat can be slightly tougher or more fibrous than breast if overcooked, and it may contain more saturated fat than white meat. To counteract this, use a meat thermometer to cook to 165°F (74°C) and let it rest before slicing; pairing with acidic sides like cranberry sauce or vinegar-based slaws can also balance the richness.
Key benefits
- High-quality protein for muscle maintenance and satiety
- Very low in carbohydrates and sugar, suitable for low-carb diets
- Contains essential minerals like selenium and phosphorus
- Naturally rich in B vitamins, especially niacin and B6
- Provides a good source of iron and zinc
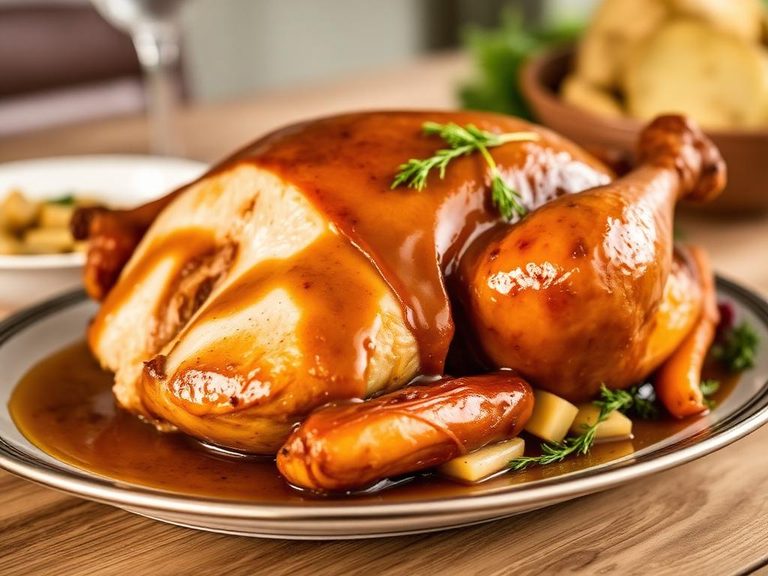
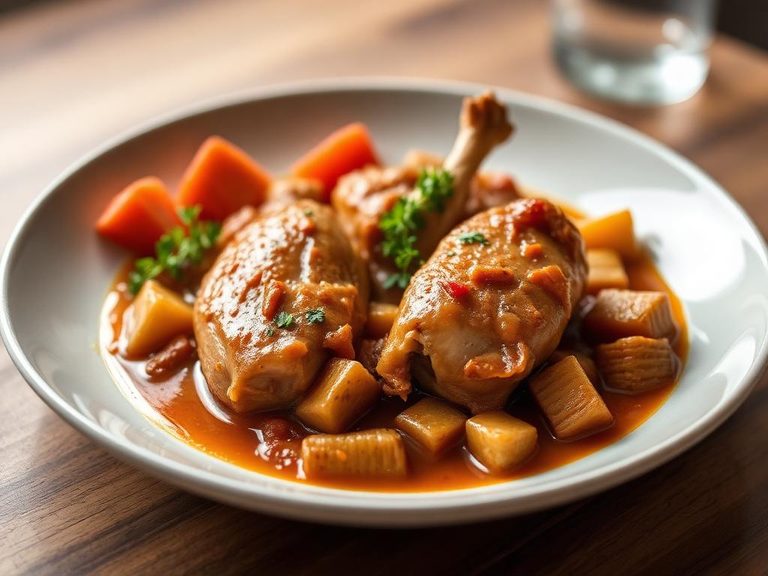
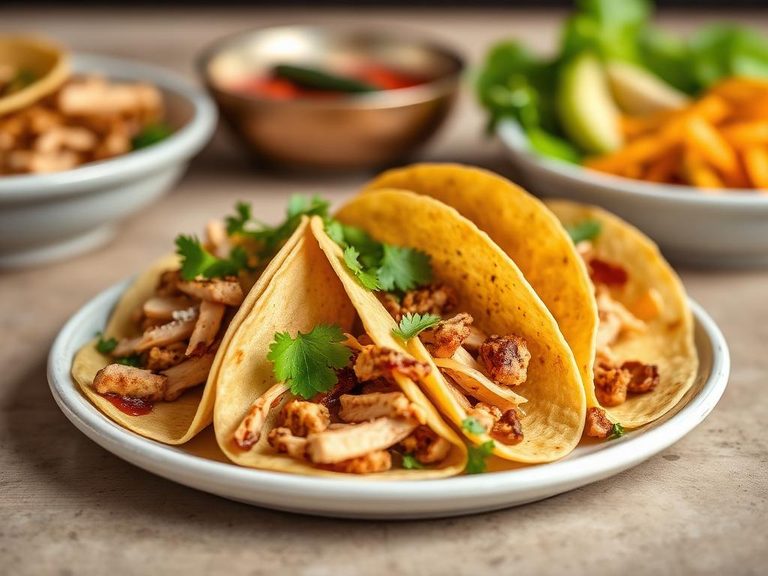
🍽️ Popular dishes


🌍 Where it's eaten
💡 Did you know?
Turkey thigh meat contains more myoglobin than breast meat, which is why it's darker and often more flavorful, but also why it can dry out faster if not cooked carefully.
Full nutrition (USDA data · scales with serving)
| Water | 67.0 g |
| Energy | 159 kcal |
| Energy | 664 kj |
| Protein | 25.1 g |
| Total lipid (fat) | 6.3 g |
| Ash | 1.2 g |
| Carbohydrate, by difference | 0.46 g |
| Fiber, total dietary | 0.00 g |
| Total Sugars | 0.00 g |
| Calcium, Ca | 4.0 mg |
| Iron, Fe | 1.6 mg |
| Magnesium, Mg | 23.0 mg |
| Phosphorus, P | 200 mg |
| Potassium, K | 296 mg |
| Sodium, Na | 104 mg |
| Zinc, Zn | 3.3 mg |
| Copper, Cu | 0.09 mg |
| Manganese, Mn | 0.01 mg |
| Selenium, Se | 29.3 ug |
| Vitamin C, total ascorbic acid | 0.00 mg |
| Thiamin | 0.05 mg |
| Riboflavin | 0.32 mg |
| Niacin | 6.9 mg |
| Pantothenic acid | 1.2 mg |
| Vitamin B-6 | 0.48 mg |
| Folate, total | 8.0 ug |
| Folic acid | 0.00 ug |
| Folate, food | 8.0 ug |
| Folate, DFE | 8.0 ug |
| Choline, total | 104 mg |
| Betaine | 7.5 mg |
| Vitamin B-12 | 1.6 ug |
| Vitamin B-12, added | 0.00 ug |
| Vitamin A, RAE | 6.0 ug |
| Retinol | 6.0 ug |
| Carotene, beta | 0.00 ug |
| Carotene, alpha | 0.00 ug |
| Cryptoxanthin, beta | 0.00 ug |
| Vitamin A, IU | 19.0 iu |
| Lycopene | 0.00 ug |
| Lutein + zeaxanthin | 1.0 ug |
| Vitamin E (alpha-tocopherol) | 0.07 mg |
| Vitamin E, added | 0.00 mg |
| Vitamin D (D2 + D3), International Units | 10.0 iu |
| Vitamin D (D2 + D3) | 0.30 ug |
| Vitamin D3 (cholecalciferol) | 0.30 ug |
| Vitamin K (phylloquinone) | 0.00 ug |
| Alcohol, ethyl | 0.00 g |
| Caffeine | 0.00 mg |
| Theobromine | 0.00 mg |
Fat & fatty acid profile (per 100g)
| Fatty acids, total saturated | 2.0 g |
| SFA 4:0 | 0.00 g |
| SFA 6:0 | 0.00 g |
| SFA 8:0 | 0.00 g |
| SFA 10:0 | 0.01 g |
| SFA 12:0 | 0.02 g |
| SFA 14:0 | 0.06 g |
| SFA 15:0 | 0.01 g |
| SFA 16:0 | 1.4 g |
| SFA 17:0 | 0.02 g |
| SFA 18:0 | 0.53 g |
| SFA 20:0 | 0.01 g |
| SFA 22:0 | 0.01 g |
| SFA 24:0 | 0.01 g |
| Fatty acids, total monounsaturated | 2.3 g |
| MUFA 14:1 | 0.01 g |
| MUFA 15:1 | 0.00 g |
| MUFA 16:1 | 0.26 g |
| MUFA 16:1 c | 0.25 g |
| MUFA 17:1 | 0.01 g |
| MUFA 18:1 | 2.0 g |
| MUFA 18:1 c | 1.9 g |
| MUFA 20:1 | 0.03 g |
| MUFA 22:1 | 0.01 g |
| MUFA 22:1 c | 0.00 g |
| MUFA 24:1 c | 0.01 g |
| Fatty acids, total polyunsaturated | 1.9 g |
| PUFA 18:2 | 1.7 g |
| PUFA 18:2 n-6 c,c | 1.6 g |
| PUFA 18:2 CLAs | 0.01 g |
| PUFA 18:3 | 0.10 g |
| PUFA 18:3 n-3 c,c,c (ALA) | 0.10 g |
| PUFA 18:3 n-6 c,c,c | 0.00 g |
| PUFA 18:4 | 0.00 g |
| PUFA 20:2 n-6 c,c | 0.01 g |
| PUFA 20:3 | 0.01 g |
| PUFA 20:3 n-3 | 0.00 g |
| PUFA 20:3 n-6 | 0.01 g |
| PUFA 20:4 | 0.11 g |
| PUFA 20:5 n-3 (EPA) | 0.00 g |
| PUFA 22:4 | 0.02 g |
| PUFA 22:5 n-3 (DPA) | 0.01 g |
| PUFA 22:6 n-3 (DHA) | 0.01 g |
| Fatty acids, total trans | 0.09 g |
| Fatty acids, total trans-monoenoic | 0.07 g |
| TFA 16:1 t | 0.01 g |
| TFA 18:1 t | 0.05 g |
| TFA 22:1 t | 0.01 g |
| TFA 18:2 t not further defined | 0.02 g |
| Fatty acids, total trans-polyenoic | 0.02 g |
| Cholesterol | 116 mg |
Amino acid profile (per 100g)
| Tryptophan | 0.31 g |
| Threonine | 1.1 g |
| Isoleucine | 0.90 g |
| Leucine | 2.1 g |
| Lysine | 2.6 g |
| Methionine | 0.70 g |
| Cystine | 0.24 g |
| Phenylalanine | 0.91 g |
| Tyrosine | 0.86 g |
| Valine | 0.95 g |
| Arginine | 1.6 g |
| Histidine | 0.77 g |
| Alanine | 1.5 g |
| Aspartic acid | 2.4 g |
| Glutamic acid | 3.9 g |
| Glycine | 1.2 g |
| Proline | 1.2 g |
| Serine | 1.1 g |
| Hydroxyproline | 0.18 g |
FAQ
Is roasted turkey thigh healthier than turkey breast?
Turkey thigh has slightly more fat and calories than breast, but it's still lean and offers more iron and zinc. Both are excellent protein sources, so the choice depends on your dietary goals and taste preference.
How do I keep roasted turkey thigh moist?
Brine the turkey before cooking, roast at a moderate temperature (325°F/165°C), and use a meat thermometer to avoid overcooking. Letting the meat rest for 10-15 minutes after roasting helps retain juices.
Can I eat turkey thigh on a low-carb diet?
Absolutely! With only 0.46g carbs per 100g, roasted turkey thigh is an excellent low-carb protein choice. Pair it with non-starchy vegetables for a balanced, low-carb meal.
Nutrient density (calculated · NRF9.3)
Nutrient Rich Foods index: beneficial nutrients (protein, fiber, vitamins, minerals) minus saturated fat, added sugar & sodium, per 100 kcal.
NRF9.3 index — Fulgoni, Keast & Drewnowski, 2009. Computed from USDA nutrients.
Weight-loss friendliness (composite index)
Energy density 1.59 kcal/g · 63% calories from protein · 0.0 g fiber · 0.0 g sugar per 100 g.
Composite of energy density (Rolls et al., 1999), protein & fiber satiety, minus sugar. A calculated heuristic — ranks satiety-per-calorie, not a clinical measure.
Dietary load (calculated from USDA values)
Potential renal acid load. Positive = acid-forming, negative = alkaline-forming.
Sodium-to-potassium ratio: 0.35 (lower is better — aim for ≤ 1)
Sodium:potassium per WHO potassium guidance. Computed from USDA nutrients.