

Cornmeal, degermed, unenriched, yellow
Whole food · Cereal Grains and Pasta

Photo: Wikipedia
Degermed yellow cornmeal is a fine, pale-gold powder milled from corn kernels with the germ and bran removed, yielding a mild, subtly sweet flavor and a smooth, non-gritty texture when cooked. Nutritionally, it's a dense source of energy, packing nearly 80g of carbohydrates per 100g, making it a foundational staple for quick-cooking breads and porridges.
Calorie split: 8% protein · 88% carbs · 4% fat
↓ Full nutrition💚 Why it's loved
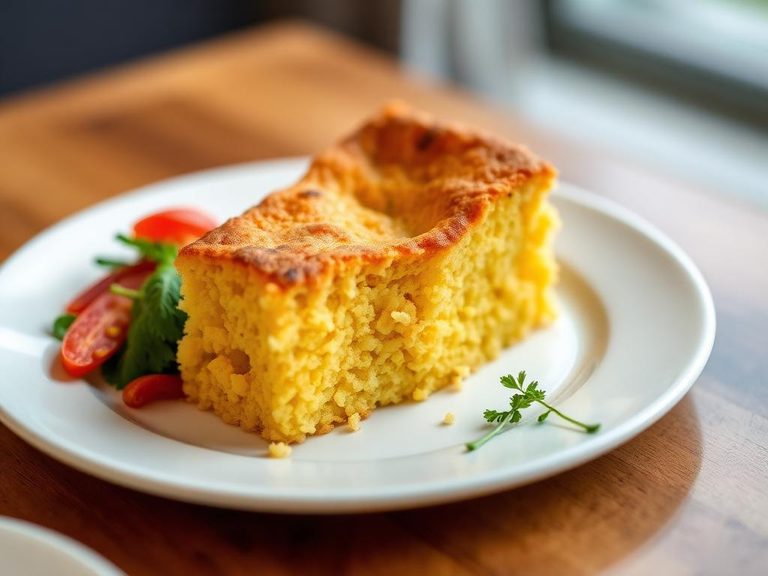
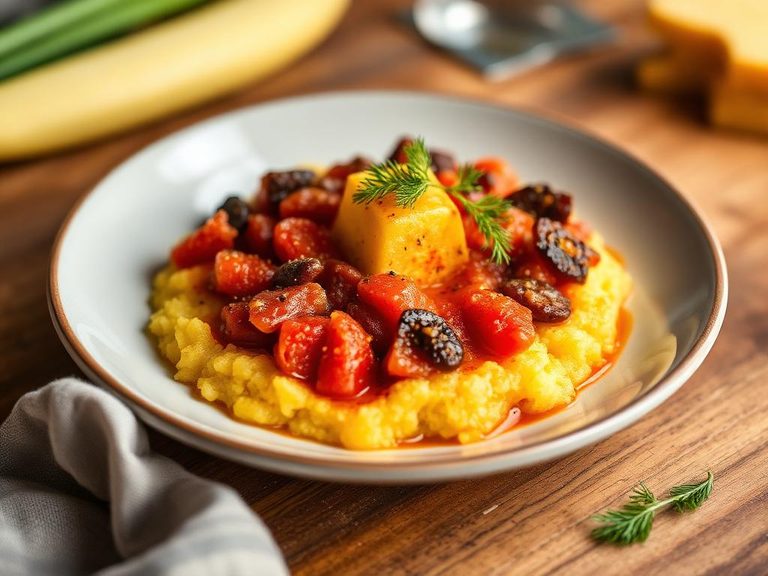
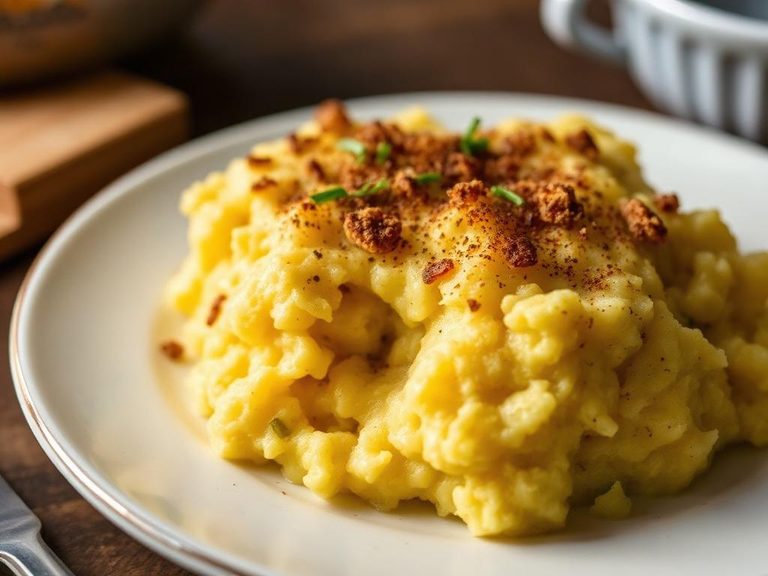
People love it for its comforting, neutral canvas that readily absorbs flavors and its ability to create everything from tender cornbread to creamy polenta. It's a cornerstone of soul food, Southern U.S. cooking, and many global cuisines, evoking a sense of home and tradition.
⚠️ Watch-outs & how to enjoy it better
Its high carbohydrate content can cause rapid blood-sugar spikes, especially when consumed alone. To counteract this, pair dishes with protein (like cheese or beans) and healthy fats (like olive oil or avocado), or choose coarser grinds for a lower glycemic impact. As a refined grain, it has lost some natural nutrients, so enriching it or pairing with nutrient-dense foods is wise.
Key benefits
- Provides quick-release energy from complex carbohydrates.
- Naturally low in fat and a source of dietary fiber.
- Gluten-free, making it suitable for celiac or gluten-sensitive diets.
- Versatile base for both savory and sweet dishes.
- Shelf-stable with a long pantry life.
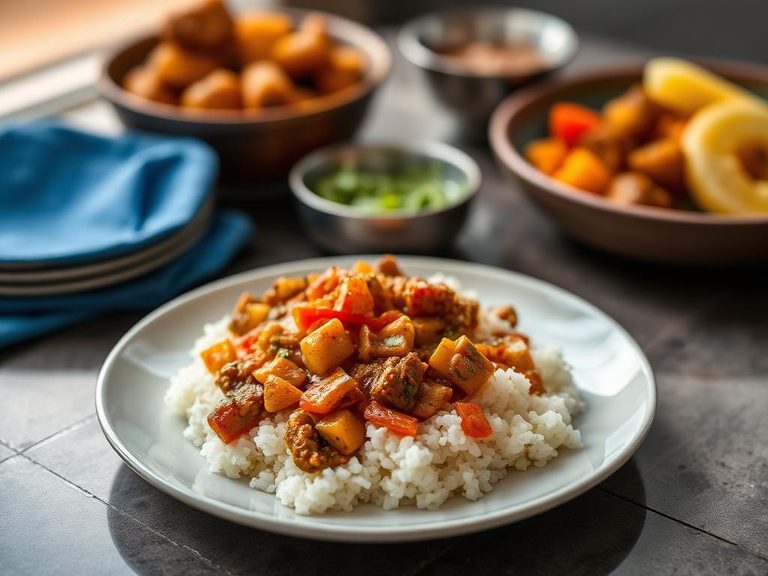
🍽️ Popular dishes


🌍 Where it's eaten
💡 Did you know?
The 'degerming' process that creates this fine meal was industrialized in the early 20th century, revolutionizing cornmeal's shelf life by removing the oily germ that would otherwise go rancid.
Full nutrition (USDA data · scales with serving)
| Water | 11.2 g |
| Energy | 370 kcal |
| Energy | 1547 kj |
| Protein | 7.1 g |
| Total lipid (fat) | 1.8 g |
| Ash | 0.51 g |
| Carbohydrate, by difference | 79.5 g |
| Fiber, total dietary | 3.9 g |
| Total Sugars | 1.6 g |
| Sucrose | 0.68 g |
| Glucose | 0.56 g |
| Fructose | 0.17 g |
| Lactose | 0.00 g |
| Maltose | 0.19 g |
| Galactose | 0.00 g |
| Starch | 73.3 g |
| Calcium, Ca | 3.0 mg |
| Iron, Fe | 1.1 mg |
| Magnesium, Mg | 32.0 mg |
| Phosphorus, P | 99.0 mg |
| Potassium, K | 142 mg |
| Sodium, Na | 7.0 mg |
| Zinc, Zn | 0.66 mg |
| Copper, Cu | 0.08 mg |
| Manganese, Mn | 0.17 mg |
| Selenium, Se | 10.5 ug |
| Vitamin C, total ascorbic acid | 0.00 mg |
| Thiamin | 0.14 mg |
| Riboflavin | 0.05 mg |
| Niacin | 1.0 mg |
| Pantothenic acid | 0.24 mg |
| Vitamin B-6 | 0.18 mg |
| Folate, total | 30.0 ug |
| Folic acid | 0.00 ug |
| Folate, food | 30.0 ug |
| Folate, DFE | 30.0 ug |
| Choline, total | 8.6 mg |
| Betaine | 1.0 mg |
| Vitamin B-12 | 0.00 ug |
| Vitamin B-12, added | 0.00 ug |
| Vitamin A, RAE | 11.0 ug |
| Retinol | 0.00 ug |
| Carotene, beta | 97.0 ug |
| Carotene, alpha | 63.0 ug |
| Cryptoxanthin, beta | 0.00 ug |
| Vitamin A, IU | 214 iu |
| Lycopene | 0.00 ug |
| Lutein + zeaxanthin | 1628 ug |
| Vitamin E (alpha-tocopherol) | 0.12 mg |
| Vitamin E, added | 0.00 mg |
| Tocopherol, beta | 0.02 mg |
| Tocopherol, gamma | 0.45 mg |
| Tocopherol, delta | 0.04 mg |
| Tocotrienol, alpha | 0.35 mg |
| Tocotrienol, beta | 0.00 mg |
| Tocotrienol, gamma | 0.58 mg |
| Tocotrienol, delta | 0.00 mg |
| Vitamin D (D2 + D3), International Units | 0.00 iu |
| Vitamin D (D2 + D3) | 0.00 ug |
| Vitamin K (phylloquinone) | 0.00 ug |
| Vitamin K (Dihydrophylloquinone) | 0.00 ug |
| Alcohol, ethyl | 0.00 g |
| Caffeine | 0.00 mg |
| Theobromine | 0.00 mg |
Fat & fatty acid profile (per 100g)
| Fatty acids, total saturated | 0.22 g |
| SFA 4:0 | 0.00 g |
| SFA 6:0 | 0.00 g |
| SFA 8:0 | 0.00 g |
| SFA 10:0 | 0.00 g |
| SFA 12:0 | 0.00 g |
| SFA 13:0 | 0.00 g |
| SFA 14:0 | 0.00 g |
| SFA 15:0 | 0.00 g |
| SFA 16:0 | 0.17 g |
| SFA 17:0 | 0.00 g |
| SFA 18:0 | 0.04 g |
| SFA 20:0 | 0.00 g |
| SFA 22:0 | 0.00 g |
| SFA 24:0 | 0.00 g |
| Fatty acids, total monounsaturated | 0.39 g |
| MUFA 14:1 | 0.00 g |
| MUFA 15:1 | 0.00 g |
| MUFA 16:1 | 0.00 g |
| MUFA 17:1 | 0.00 g |
| MUFA 18:1 | 0.39 g |
| MUFA 20:1 | 0.00 g |
| MUFA 22:1 | 0.00 g |
| MUFA 24:1 c | 0.00 g |
| Fatty acids, total polyunsaturated | 0.83 g |
| PUFA 18:2 | 0.81 g |
| PUFA 18:3 | 0.02 g |
| PUFA 18:3 n-6 c,c,c | 0.00 g |
| PUFA 18:4 | 0.00 g |
| PUFA 20:2 n-6 c,c | 0.00 g |
| PUFA 20:3 | 0.00 g |
| PUFA 20:4 | 0.00 g |
| PUFA 20:5 n-3 (EPA) | 0.00 g |
| PUFA 21:5 | 0.00 g |
| PUFA 22:4 | 0.00 g |
| PUFA 22:5 n-3 (DPA) | 0.00 g |
| PUFA 22:6 n-3 (DHA) | 0.00 g |
| Fatty acids, total trans | 0.00 g |
| Fatty acids, total trans-monoenoic | 0.00 g |
| TFA 18:1 t | 0.00 g |
| Cholesterol | 0.00 mg |
Amino acid profile (per 100g)
| Tryptophan | 0.04 g |
| Threonine | 0.17 g |
| Isoleucine | 0.24 g |
| Leucine | 1.0 g |
| Lysine | 0.10 g |
| Methionine | 0.16 g |
| Cystine | 0.16 g |
| Phenylalanine | 0.37 g |
| Tyrosine | 0.19 g |
| Valine | 0.34 g |
| Arginine | 0.24 g |
| Histidine | 0.17 g |
| Alanine | 0.56 g |
| Aspartic acid | 0.47 g |
| Glutamic acid | 1.5 g |
| Glycine | 0.22 g |
| Proline | 0.75 g |
| Serine | 0.34 g |
| Hydroxyproline | 0.00 g |
FAQ
What's the difference between degermed and whole-grain cornmeal?
Degermed cornmeal has the germ and bran removed, resulting in a finer texture, milder flavor, and longer shelf life, but with less fiber and nutrients. Whole-grain retains the germ and bran, offering more fiber, vitamins, and a heartier, nuttier taste.
Why is it called 'unenriched'?
It means no synthetic vitamins or minerals (like iron or B vitamins) have been added back after processing. This is common in many countries; in the U.S., enriched cornmeal has these nutrients added by law.
Can I use it for frying?
Yes, it's excellent for creating a crispy coating on fish, chicken, or vegetables. Its fine texture adheres well and fries to a golden crunch without burning quickly.
Nutrient density (calculated · NRF9.3)
Nutrient Rich Foods index: beneficial nutrients (protein, fiber, vitamins, minerals) minus saturated fat, added sugar & sodium, per 100 kcal.
NRF9.3 index — Fulgoni, Keast & Drewnowski, 2009. Computed from USDA nutrients.
Weight-loss friendliness (composite index)
Energy density 3.70 kcal/g · 8% calories from protein · 3.9 g fiber · 1.6 g sugar per 100 g.
Composite of energy density (Rolls et al., 1999), protein & fiber satiety, minus sugar. A calculated heuristic — ranks satiety-per-calorie, not a clinical measure.
Dietary load (calculated from USDA values)
Potential renal acid load. Positive = acid-forming, negative = alkaline-forming.
Sodium-to-potassium ratio: 0.05 (lower is better — aim for ≤ 1)
Sodium:potassium per WHO potassium guidance. Computed from USDA nutrients.