

APPLEBEE'S, chicken tenders platter
Whole food · Restaurant Foods

Photo: Wikipedia
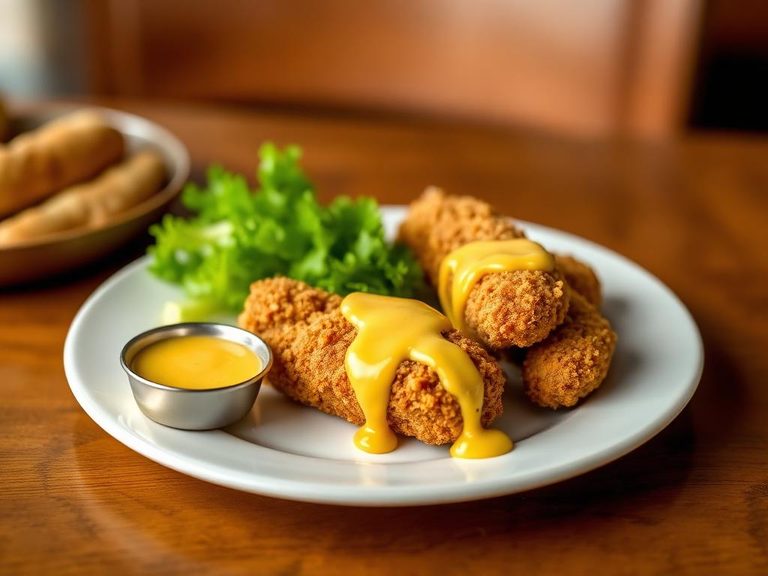
Applebee's Chicken Tenders Platter features golden, crispy-fried strips of white-meat chicken, offering a satisfying crunch and juicy, savory interior. Nutritionally, it provides a solid protein boost (19.62g per 100g) but comes with a notable fat content from the frying process and breading. It's a classic comfort food that balances indulgence with a decent protein-to-calorie ratio.
Calorie split: 26% protein · 24% carbs · 49% fat
↓ Full nutrition💚 Why it's loved
People love it for its universally appealing, savory flavor and the comforting ritual of dipping crispy tenders into sauces like honey mustard or barbecue. It's a nostalgic, crowd-pleasing staple that works as a main meal or shareable appetizer.
⚠️ Watch-outs & how to enjoy it better
The deep-fried preparation means it's high in fat and sodium, which can be a concern for heart health or blood pressure management. The refined carbohydrate breading may cause a quicker blood sugar rise compared to unbreaded chicken. To mitigate this, pair it with fiber-rich sides like steamed vegetables or a side salad, and opt for lighter dipping sauces like mustard or vinegar-based options.
Key benefits
- High-quality protein source for muscle maintenance
- Convenient, familiar, and widely available comfort food
- Satisfying texture contrast: crispy coating and tender meat
- Provides quick energy from carbohydrates in the breading
🍽️ Popular dishes


🌍 Where it's eaten
💡 Did you know?
The modern chicken tender is often credited to a 1974 kitchen accident at a New Hampshire restaurant, where a chef sliced a strip from the breast and fried it, creating a new menu item.
Full nutrition (USDA data · scales with serving)
| Water | 43.4 g |
| Energy | 297 kcal |
| Energy | 1241 kj |
| Protein | 19.6 g |
| Total lipid (fat) | 16.2 g |
| Ash | 2.8 g |
| Carbohydrate, by difference | 18.0 g |
| Fiber, total dietary | 1.0 g |
| Total Sugars | 0.36 g |
| Sucrose | 0.00 g |
| Glucose | 0.36 g |
| Fructose | 0.00 g |
| Lactose | 0.00 g |
| Maltose | 0.00 g |
| Galactose | 0.00 g |
| Starch | 17.0 g |
| Calcium, Ca | 23.0 mg |
| Iron, Fe | 0.90 mg |
| Magnesium, Mg | 30.0 mg |
| Phosphorus, P | 298 mg |
| Potassium, K | 336 mg |
| Sodium, Na | 740 mg |
| Zinc, Zn | 0.71 mg |
| Copper, Cu | 0.07 mg |
| Manganese, Mn | 0.26 mg |
| Selenium, Se | 16.8 ug |
| Thiamin | 0.10 mg |
| Riboflavin | 0.18 mg |
| Niacin | 7.8 mg |
| Pantothenic acid | 1.7 mg |
| Vitamin B-6 | 0.51 mg |
| Vitamin B-12 | 0.14 ug |
| Vitamin A, RAE | 9.0 ug |
| Retinol | 7.0 ug |
| Carotene, beta | 20.0 ug |
| Carotene, alpha | 1.0 ug |
| Cryptoxanthin, beta | 11.0 ug |
| Vitamin A, IU | 67.0 iu |
| Lycopene | 5.0 ug |
| Lutein + zeaxanthin | 72.0 ug |
| Vitamin E (alpha-tocopherol) | 1.4 mg |
| Tocopherol, beta | 0.24 mg |
| Tocopherol, gamma | 7.9 mg |
| Tocopherol, delta | 3.5 mg |
| Tocotrienol, alpha | 0.03 mg |
| Tocotrienol, beta | 0.17 mg |
| Tocotrienol, gamma | 0.08 mg |
| Tocotrienol, delta | 0.00 mg |
Fat & fatty acid profile (per 100g)
| Fatty acids, total saturated | 2.8 g |
| SFA 4:0 | 0.00 g |
| SFA 6:0 | 0.00 g |
| SFA 8:0 | 0.01 g |
| SFA 10:0 | 0.01 g |
| SFA 12:0 | 0.00 g |
| SFA 14:0 | 0.02 g |
| SFA 15:0 | 0.01 g |
| SFA 16:0 | 1.8 g |
| SFA 17:0 | 0.02 g |
| SFA 18:0 | 0.89 g |
| SFA 20:0 | 0.05 g |
| SFA 22:0 | 0.05 g |
| SFA 24:0 | 0.02 g |
| Fatty acids, total monounsaturated | 4.4 g |
| MUFA 14:1 | 0.00 g |
| MUFA 15:1 | 0.00 g |
| MUFA 16:1 | 0.06 g |
| MUFA 16:1 c | 0.06 g |
| MUFA 17:1 | 0.01 g |
| MUFA 18:1 | 3.4 g |
| MUFA 18:1 c | 3.4 g |
| MUFA 20:1 | 0.92 g |
| MUFA 22:1 | 0.00 g |
| MUFA 22:1 c | 0.00 g |
| MUFA 24:1 c | 0.00 g |
| Fatty acids, total polyunsaturated | 7.0 g |
| PUFA 18:2 | 6.9 g |
| PUFA 18:2 n-6 c,c | 6.8 g |
| PUFA 18:2 CLAs | 0.02 g |
| PUFA 18:3 | 0.06 g |
| PUFA 18:3 n-3 c,c,c (ALA) | 0.00 g |
| PUFA 18:3 n-6 c,c,c | 0.06 g |
| PUFA 18:3i | 0.00 g |
| PUFA 18:4 | 0.00 g |
| PUFA 20:2 n-6 c,c | 0.01 g |
| PUFA 20:3 | 0.01 g |
| PUFA 20:3 n-3 | 0.00 g |
| PUFA 20:3 n-6 | 0.01 g |
| PUFA 20:4 | 0.05 g |
| PUFA 20:5 n-3 (EPA) | 0.00 g |
| PUFA 22:4 | 0.01 g |
| PUFA 22:5 n-3 (DPA) | 0.00 g |
| PUFA 22:6 n-3 (DHA) | 0.00 g |
| Fatty acids, total trans | 0.12 g |
| Fatty acids, total trans-monoenoic | 0.04 g |
| TFA 16:1 t | 0.00 g |
| TFA 18:1 t | 0.04 g |
| TFA 22:1 t | 0.00 g |
| TFA 18:2 t not further defined | 0.09 g |
| Fatty acids, total trans-polyenoic | 0.09 g |
| Cholesterol | 52.0 mg |
Amino acid profile (per 100g)
| Tryptophan | 0.22 g |
| Threonine | 0.64 g |
| Isoleucine | 1.0 g |
| Leucine | 1.6 g |
| Lysine | 1.5 g |
| Methionine | 0.52 g |
| Cystine | 0.27 g |
| Phenylalanine | 0.82 g |
| Tyrosine | 0.52 g |
| Valine | 1.1 g |
| Arginine | 1.2 g |
| Histidine | 0.71 g |
| Alanine | 1.1 g |
| Aspartic acid | 1.7 g |
| Glutamic acid | 3.5 g |
| Glycine | 0.86 g |
| Proline | 0.97 g |
| Serine | 0.59 g |
| Hydroxyproline | 0.04 g |
FAQ
How does the nutrition compare to grilled chicken?
Fried chicken tenders have significantly more fat and calories per gram than plain grilled chicken breast due to the oil absorbed during cooking and the added breading.
Are chicken tenders a good source of protein?
Yes, they are a good source of protein, providing about 20g per 100g, which is comparable to other chicken preparations, though the frying adds extra calories.
What are the most common allergens in chicken tenders?
Common allergens include wheat (in the breading), eggs (often in the batter), and sometimes milk or soy, depending on the specific recipe and fryer oil used.
Nutrient density (calculated · NRF9.3)
Nutrient Rich Foods index: beneficial nutrients (protein, fiber, vitamins, minerals) minus saturated fat, added sugar & sodium, per 100 kcal.
NRF9.3 index — Fulgoni, Keast & Drewnowski, 2009. Computed from USDA nutrients.
Weight-loss friendliness (composite index)
Energy density 2.97 kcal/g · 26% calories from protein · 1.0 g fiber · 0.4 g sugar per 100 g.
Composite of energy density (Rolls et al., 1999), protein & fiber satiety, minus sugar. A calculated heuristic — ranks satiety-per-calorie, not a clinical measure.
Dietary load (calculated from USDA values)
Potential renal acid load. Positive = acid-forming, negative = alkaline-forming.
Sodium-to-potassium ratio: 2.20 (lower is better — aim for ≤ 1)
Sodium:potassium per WHO potassium guidance. Computed from USDA nutrients.