

Cookies, oatmeal, soft, with raisins
Whole food · Baked Products
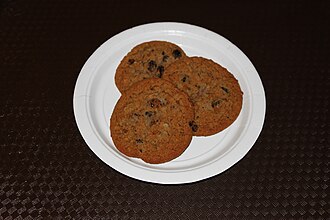
Photo: Wikipedia
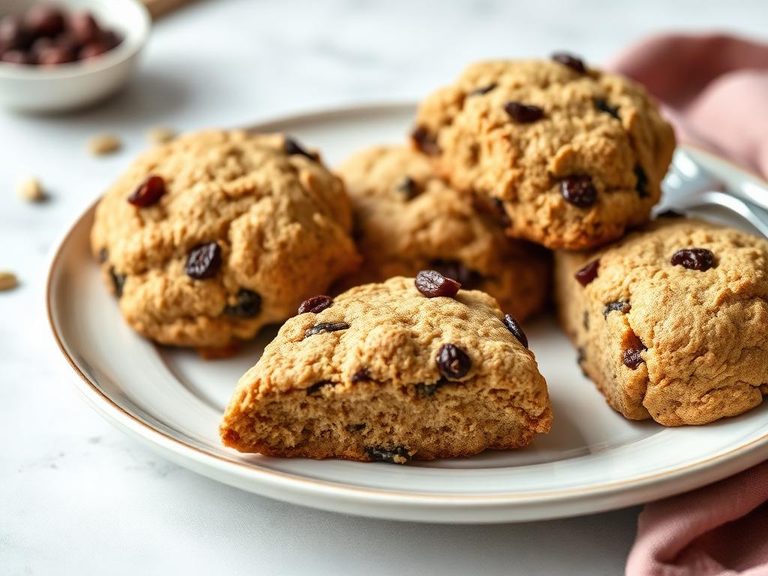
A soft, chewy oatmeal cookie studded with plump, sweet raisins, offering a comforting blend of hearty oats and bursts of fruity sweetness. The texture is tender and slightly dense, with a satisfying, home-baked quality. Nutritionally, it provides a notable amount of dietary fiber from the oats, which can aid in digestion.
Calorie split: 5% protein · 65% carbs · 30% fat
↓ Full nutrition💚 Why it's loved
People adore the classic, comforting combination of sweet raisins and hearty oats, which evokes a sense of nostalgia and home baking. Its soft, chewy texture makes it a satisfying treat that pairs perfectly with a glass of milk or a cup of coffee.
⚠️ Watch-outs & how to enjoy it better
The high carbohydrate content can lead to blood-sugar spikes, especially for those with insulin sensitivity. To counteract this, pair a cookie with a source of protein or healthy fat (like a handful of nuts or a cheese stick) and practice portion control. Be mindful of added sugars and potential allergens like wheat and oats (if processed in a facility with other grains).
Key benefits
- Good source of dietary fiber from oats
- Provides quick energy from carbohydrates
- Contains some plant-based protein
- Offers iron and antioxidants from raisins
- Convenient, portable snack
🍽️ Popular dishes

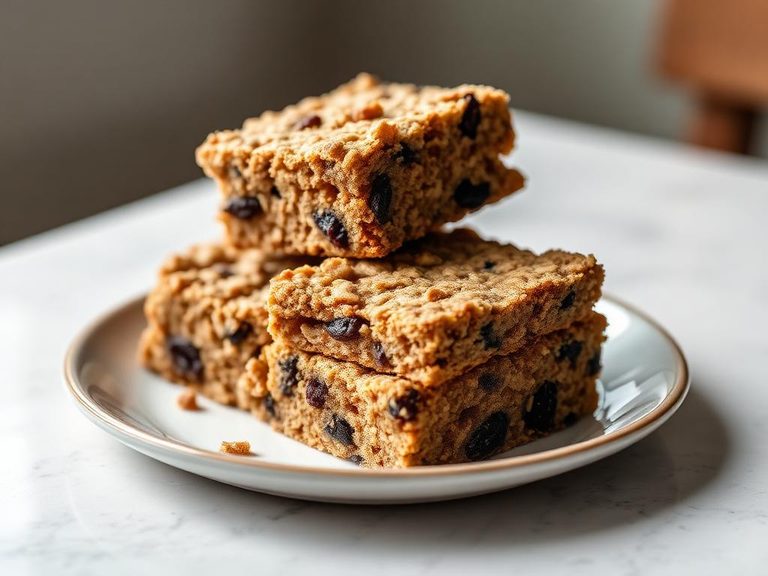
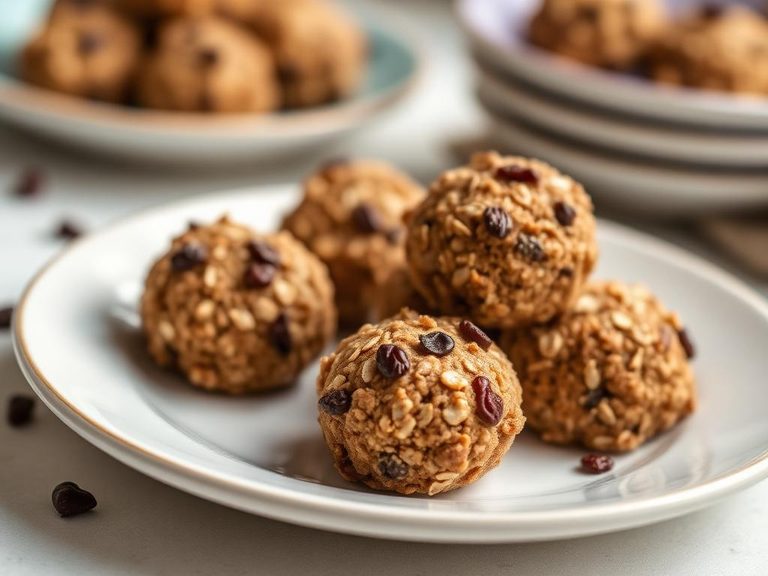
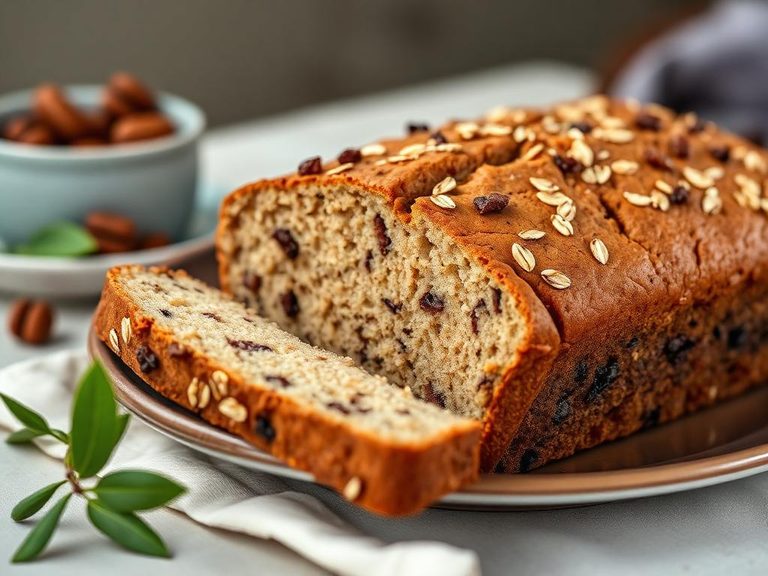
🌍 Where it's eaten
💡 Did you know?
The raisins in these cookies are often soaked in hot water or juice before baking to make them extra plump and juicy, preventing them from drawing moisture from the cookie dough.
Full nutrition (USDA data · scales with serving)
| Water | 8.8 g |
| Energy (Atwater General Factors) | 430 kcal |
| Energy | 430 kcal |
| Energy | 1800 kj |
| Nitrogen | 0.93 g |
| Protein | 5.8 g |
| Total lipid (fat) | 14.3 g |
| Total fat (NLEA) | 13.7 g |
| Ash | 1.4 g |
| Carbohydrate, by difference | 69.6 g |
| Carbohydrate, by summation | 67.9 g |
| Fiber, total dietary | 3.3 g |
| Sugars, Total | 34.8 g |
| Sucrose | 15.1 g |
| Glucose | 7.6 g |
| Fructose | 11.1 g |
| Lactose | 0.00 g |
| Maltose | 1.0 g |
| Galactose | 0.00 g |
| Starch | 29.8 g |
| Calcium, Ca | 29.0 mg |
| Iron, Fe | 2.3 mg |
| Magnesium, Mg | 32.4 mg |
| Phosphorus, P | 111 mg |
| Potassium, K | 245 mg |
| Sodium, Na | 314 mg |
| Zinc, Zn | 0.62 mg |
| Copper, Cu | 0.14 mg |
| Manganese, Mn | 0.76 mg |
| Selenium, Se | 6.0 ug |
| Thiamin | 0.29 mg |
| Riboflavin | 0.22 mg |
| Niacin | 2.1 mg |
| Pantothenic acid | 0.40 mg |
| Vitamin B-6 | 0.07 mg |
| Folate, total | 34.0 ug |
| Vitamin E (alpha-tocopherol) | 2.7 mg |
| Tocopherol, beta | 0.22 mg |
| Tocopherol, gamma | 5.3 mg |
| Tocopherol, delta | 2.4 mg |
| Tocotrienol, alpha | 0.80 mg |
| Tocotrienol, beta | 0.38 mg |
| Tocotrienol, gamma | 0.51 mg |
| Tocotrienol, delta | 0.00 mg |
| Vitamin K (phylloquinone) | 17.1 ug |
| Vitamin K (Dihydrophylloquinone) | 0.00 ug |
| Vitamin K (Menaquinone-4) | 0.00 ug |
Fat & fatty acid profile (per 100g)
| Fatty acids, total saturated | 4.8 g |
| SFA 4:0 | 0.01 g |
| SFA 6:0 | 0.00 g |
| SFA 8:0 | 0.01 g |
| SFA 10:0 | 0.01 g |
| SFA 11:0 | 0.00 g |
| SFA 12:0 | 0.07 g |
| SFA 14:0 | 0.06 g |
| SFA 15:0 | 0.01 g |
| SFA 16:0 | 2.2 g |
| SFA 17:0 | 0.01 g |
| SFA 18:0 | 2.3 g |
| SFA 20:0 | 0.05 g |
| SFA 22:0 | 0.04 g |
| SFA 24:0 | 0.02 g |
| Fatty acids, total monounsaturated | 4.0 g |
| MUFA 14:1 c | 0.00 g |
| MUFA 15:1 | 0.00 g |
| MUFA 16:1 c | 0.02 g |
| MUFA 17:1 | 0.01 g |
| MUFA 17:1 c | 0.01 g |
| MUFA 18:1 c | 3.9 g |
| MUFA 20:1 c | 0.07 g |
| MUFA 22:1 c | 0.00 g |
| MUFA 22:1 n-9 | 0.00 g |
| MUFA 24:1 c | 0.00 g |
| Fatty acids, total polyunsaturated | 4.9 g |
| PUFA 18:2 c | 4.2 g |
| PUFA 18:2 n-6 c,c | 4.2 g |
| PUFA 18:2 CLAs | 0.01 g |
| PUFA 18:3 c | 0.66 g |
| PUFA 18:3 n-3 c,c,c (ALA) | 0.63 g |
| PUFA 18:3 n-6 c,c,c | 0.03 g |
| PUFA 18:4 | 0.00 g |
| PUFA 20:2 c | 0.00 g |
| PUFA 20:2 n-6 c,c | 0.00 g |
| PUFA 20:3 c | 0.00 g |
| PUFA 20:3 n-3 | 0.00 g |
| PUFA 20:3 n-6 | 0.00 g |
| PUFA 20:3 n-9 | 0.00 g |
| PUFA 20:4 | 0.01 g |
| PUFA 20:4c | 0.01 g |
| PUFA 20:5c | 0.00 g |
| PUFA 20:5 n-3 (EPA) | 0.00 g |
| PUFA 22:2 | 0.00 g |
| PUFA 22:5 c | 0.00 g |
| PUFA 22:4 | 0.00 g |
| PUFA 22:5 n-3 (DPA) | 0.00 g |
| PUFA 22:6 c | 0.00 g |
| PUFA 22:6 n-3 (DHA) | 0.00 g |
| Fatty acids, total trans | 0.04 g |
| Fatty acids, total trans-monoenoic | 0.02 g |
| TFA 16:1 t | 0.00 g |
| TFA 18:1 t | 0.02 g |
| TFA 22:1 t | 0.00 g |
| Fatty acids, total trans-dienoic | 0.02 g |
| TFA 18:2 t not further defined | 0.02 g |
| Fatty acids, total trans-polyenoic | 0.00 g |
| TFA 18:3 t | 0.00 g |
Amino acid profile (per 100g)
Estimated from Cookies, animal crackers (includes arrowroot, tea biscuits) — USDA does not publish this profile for Cookies.
| Tryptophan | 0.10 g |
| Threonine | 0.19 g |
| Isoleucine | 0.26 g |
| Leucine | 0.47 g |
| Lysine | 0.24 g |
| Methionine | 0.12 g |
| Cystine | 0.15 g |
| Phenylalanine | 0.32 g |
| Tyrosine | 0.20 g |
| Valine | 0.30 g |
| Arginine | 0.26 g |
| Histidine | 0.14 g |
| Alanine | 0.21 g |
| Aspartic acid | 0.29 g |
| Glutamic acid | 2.3 g |
| Glycine | 0.23 g |
| Proline | 0.76 g |
| Serine | 0.36 g |
FAQ
Are oatmeal raisin cookies healthier than chocolate chip cookies?
Generally, yes. Oatmeal raisin cookies often contain more fiber from the oats and raisins, and slightly less fat than a typical chocolate chip cookie. However, both are still treats high in sugar and calories.
Why are my oatmeal raisin cookies tough instead of soft?
Overmixing the dough or using too much flour can make them tough. Be sure to mix just until combined and measure flour accurately. Using brown sugar and an extra egg yolk can also enhance softness.
Can I make them without raisins?
Absolutely. You can substitute raisins with dried cranberries, chopped dates, or chocolate chips. The base recipe works well with many mix-ins.
Nutrient density (calculated · NRF9.3)
Nutrient Rich Foods index: beneficial nutrients (protein, fiber, vitamins, minerals) minus saturated fat, added sugar & sodium, per 100 kcal.
NRF9.3 index — Fulgoni, Keast & Drewnowski, 2009. Computed from USDA nutrients.
Weight-loss friendliness (composite index)
Energy density 4.30 kcal/g · 5% calories from protein · 3.3 g fiber · 0.0 g sugar per 100 g.
Composite of energy density (Rolls et al., 1999), protein & fiber satiety, minus sugar. A calculated heuristic — ranks satiety-per-calorie, not a clinical measure.
Dietary load (calculated from USDA values)
Potential renal acid load. Positive = acid-forming, negative = alkaline-forming.
Sodium-to-potassium ratio: 1.28 (lower is better — aim for ≤ 1)
Sodium:potassium per WHO potassium guidance. Computed from USDA nutrients.