

Rice, brown, parboiled, cooked, UNCLE BENS
Whole food · Cereal Grains and Pasta

Photo: Wikipedia
UNCLE BENS parboiled brown rice offers a chewy, nutty bite with a slightly firmer texture than white rice, thanks to its partial steaming before milling. Each 100g serving delivers a solid 3.09g of protein and 1.7g of fiber, making it a more substantial whole grain option. It's a convenient, shelf-stable staple that cooks up with distinct, separate grains.
Calorie split: 9% protein · 86% carbs · 5% fat
↓ Full nutrition💚 Why it's loved
People love its satisfying, chewy texture and mild, nutty flavor that pairs well with both savory and spicy dishes. It's prized for its versatility as a base for stir-fries, pilafs, and grain bowls, and its long shelf life makes it a pantry hero.
⚠️ Watch-outs & how to enjoy it better
Its low fiber and high carbohydrate content (31.33g per 100g) can still cause blood-sugar spikes for some individuals, especially when eaten alone. To counteract this, pair it with a source of protein (like chicken or beans) and healthy fat (like avocado or olive oil) to slow digestion. The cooking time is also longer than white rice.
Key benefits
- Good source of plant-based protein (3.09g per 100g).
- Provides dietary fiber (1.7g per 100g) for digestive health.
- Low in fat (0.85g per 100g) and naturally sugar-free.
- Parboiling helps retain more nutrients than regular milling.
- Complex carbohydrates for sustained energy release.
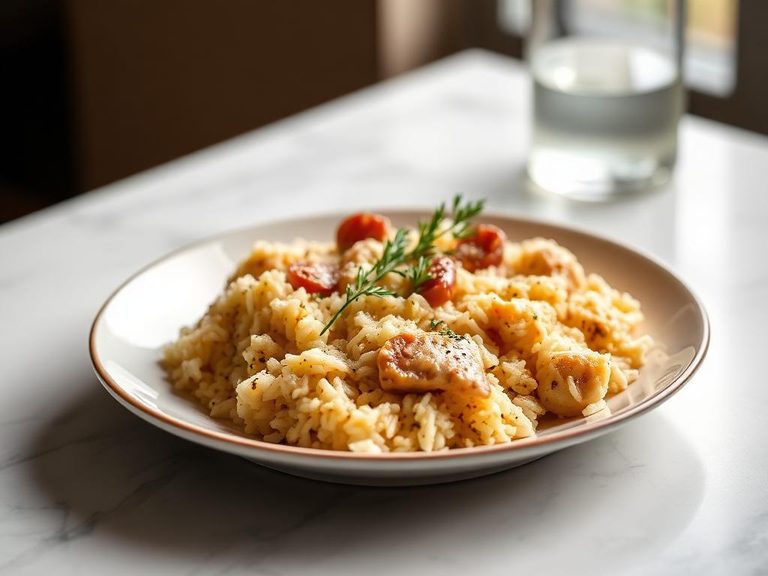
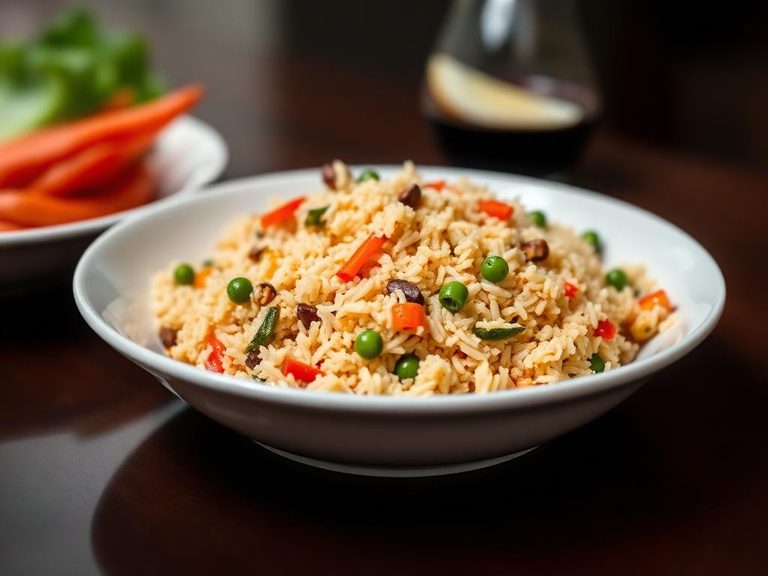
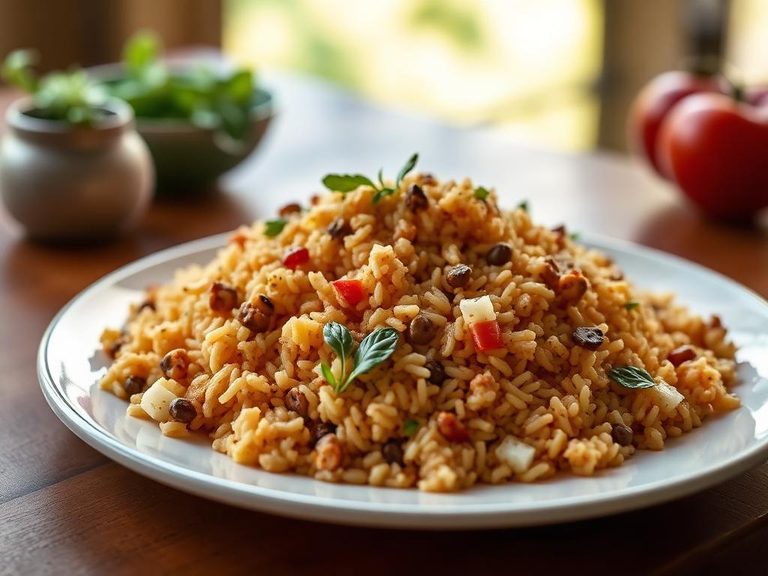
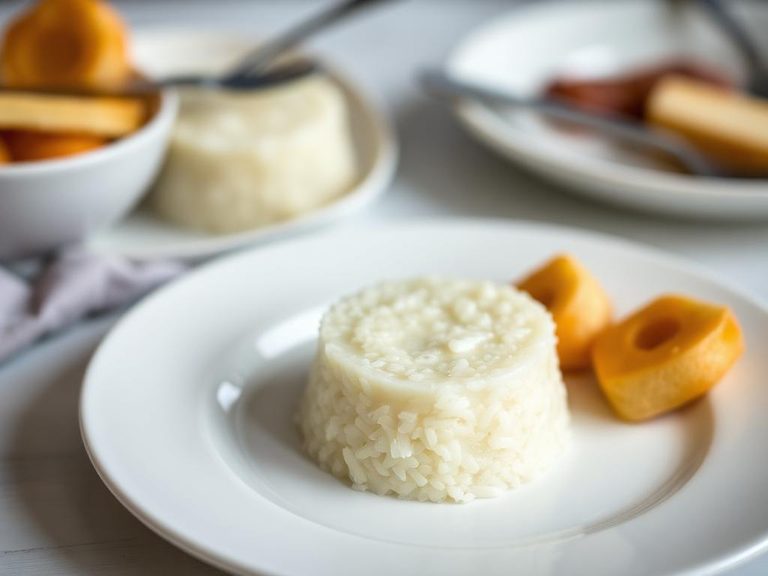
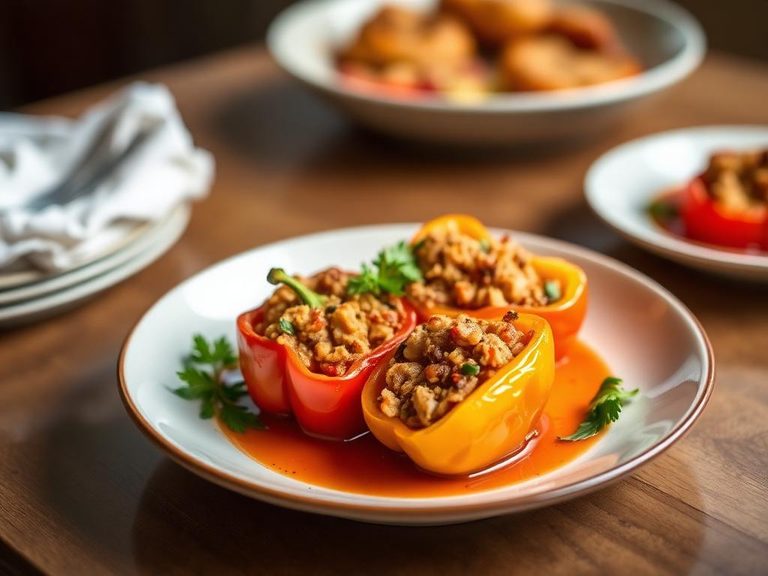
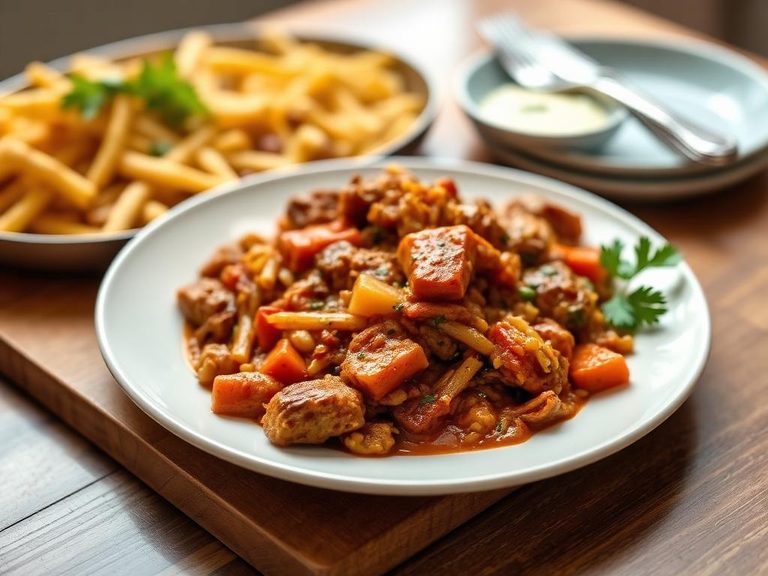
🍽️ Popular dishes
🌍 Where it's eaten
💡 Did you know?
Parboiling, the process used for this rice, involves soaking, steaming, and drying the paddy *before* milling, which drives nutrients from the bran into the endosperm, making the final grain more nutritious than regular brown rice.
Full nutrition (USDA data · scales with serving)
| Water | 64.4 g |
| Energy | 147 kcal |
| Energy | 614 kj |
| Protein | 3.1 g |
| Total lipid (fat) | 0.85 g |
| Ash | 0.35 g |
| Carbohydrate, by difference | 31.3 g |
| Fiber, total dietary | 1.7 g |
| Total Sugars | 0.15 g |
| Sucrose | 0.15 g |
| Glucose | 0.00 g |
| Fructose | 0.00 g |
| Lactose | 0.00 g |
| Maltose | 0.00 g |
| Galactose | 0.00 g |
| Starch | 29.3 g |
| Calcium, Ca | 3.0 mg |
| Iron, Fe | 0.53 mg |
| Magnesium, Mg | 39.0 mg |
| Phosphorus, P | 96.0 mg |
| Potassium, K | 61.0 mg |
| Sodium, Na | 4.0 mg |
| Zinc, Zn | 0.77 mg |
| Copper, Cu | 0.13 mg |
| Manganese, Mn | 1.1 mg |
| Selenium, Se | 9.4 ug |
| Thiamin | 0.10 mg |
| Riboflavin | 0.07 mg |
| Niacin | 1.9 mg |
| Pantothenic acid | 0.28 mg |
| Vitamin B-6 | 0.11 mg |
| Folate, total | 4.0 ug |
| Folate, food | 4.0 ug |
| Choline, total | 4.4 mg |
| Vitamin E (alpha-tocopherol) | 0.00 mg |
| Tocopherol, beta | 0.00 mg |
| Tocopherol, gamma | 0.00 mg |
| Tocopherol, delta | 0.00 mg |
| Tocotrienol, alpha | 0.11 mg |
| Tocotrienol, beta | 0.00 mg |
| Tocotrienol, gamma | 0.30 mg |
| Tocotrienol, delta | 0.00 mg |
| Vitamin K (phylloquinone) | 0.40 ug |
| Vitamin K (Dihydrophylloquinone) | 0.00 ug |
| Vitamin K (Menaquinone-4) | 0.00 ug |
Fat & fatty acid profile (per 100g)
| Fatty acids, total saturated | 0.21 g |
| SFA 4:0 | 0.00 g |
| SFA 6:0 | 0.00 g |
| SFA 8:0 | 0.00 g |
| SFA 10:0 | 0.01 g |
| SFA 12:0 | 0.00 g |
| SFA 14:0 | 0.01 g |
| SFA 15:0 | 0.00 g |
| SFA 16:0 | 0.16 g |
| SFA 17:0 | 0.00 g |
| SFA 18:0 | 0.02 g |
| SFA 20:0 | 0.00 g |
| SFA 22:0 | 0.00 g |
| SFA 24:0 | 0.00 g |
| Fatty acids, total monounsaturated | 0.30 g |
| MUFA 14:1 | 0.00 g |
| MUFA 15:1 | 0.00 g |
| MUFA 16:1 | 0.00 g |
| MUFA 16:1 c | 0.00 g |
| MUFA 17:1 | 0.00 g |
| MUFA 18:1 | 0.30 g |
| MUFA 18:1 c | 0.30 g |
| MUFA 20:1 | 0.00 g |
| MUFA 22:1 | 0.00 g |
| MUFA 22:1 c | 0.00 g |
| MUFA 24:1 c | 0.00 g |
| Fatty acids, total polyunsaturated | 0.27 g |
| PUFA 18:2 | 0.26 g |
| PUFA 18:2 n-6 c,c | 0.26 g |
| PUFA 18:2 CLAs | 0.00 g |
| PUFA 18:3 | 0.01 g |
| PUFA 18:3 n-3 c,c,c (ALA) | 0.01 g |
| PUFA 18:3 n-6 c,c,c | 0.00 g |
| PUFA 18:3i | 0.00 g |
| PUFA 18:4 | 0.00 g |
| PUFA 20:2 n-6 c,c | 0.00 g |
| PUFA 20:3 | 0.00 g |
| PUFA 20:3 n-3 | 0.00 g |
| PUFA 20:3 n-6 | 0.00 g |
| PUFA 20:4 | 0.00 g |
| PUFA 20:5 n-3 (EPA) | 0.00 g |
| PUFA 22:4 | 0.00 g |
| PUFA 22:5 n-3 (DPA) | 0.00 g |
| PUFA 22:6 n-3 (DHA) | 0.00 g |
| Fatty acids, total trans | 0.00 g |
| Fatty acids, total trans-monoenoic | 0.00 g |
| TFA 16:1 t | 0.00 g |
| TFA 18:1 t | 0.00 g |
| TFA 22:1 t | 0.00 g |
| TFA 18:2 t not further defined | 0.00 g |
| Fatty acids, total trans-polyenoic | 0.00 g |
Amino acid profile (per 100g)
Estimated from Rice, brown, medium-grain, cooked (Includes foods for USDA's Food Distribution Program) — USDA does not publish this profile for Rice.
| Tryptophan | 0.03 g |
| Threonine | 0.09 g |
| Isoleucine | 0.10 g |
| Leucine | 0.19 g |
| Lysine | 0.09 g |
| Methionine | 0.05 g |
| Cystine | 0.03 g |
| Phenylalanine | 0.12 g |
| Tyrosine | 0.09 g |
| Valine | 0.14 g |
| Arginine | 0.17 g |
| Histidine | 0.06 g |
| Alanine | 0.14 g |
| Aspartic acid | 0.22 g |
| Glutamic acid | 0.47 g |
| Glycine | 0.11 g |
| Proline | 0.11 g |
| Serine | 0.12 g |
FAQ
What's the difference between parboiled brown rice and regular brown rice?
Parboiled brown rice is partially cooked in its husk before milling. This process gelatinizes the starch, making the grains firmer, less sticky, and more resistant to overcooking. It also helps retain more B vitamins compared to regular brown rice.
Is this rice gluten-free?
Yes, brown rice is naturally gluten-free. However, always check the packaging for potential cross-contamination warnings if you have celiac disease or severe gluten sensitivity.
How does it affect blood sugar compared to white rice?
While it has a lower glycemic index than white rice due to its fiber and intact bran, it is still a high-carbohydrate food. The parboiling process can make its starch more rapidly digestible. Pairing it with protein and fat is the best strategy for blood sugar management.
Nutrient density (calculated · NRF9.3)
Nutrient Rich Foods index: beneficial nutrients (protein, fiber, vitamins, minerals) minus saturated fat, added sugar & sodium, per 100 kcal.
NRF9.3 index — Fulgoni, Keast & Drewnowski, 2009. Computed from USDA nutrients.
Weight-loss friendliness (composite index)
Energy density 1.47 kcal/g · 8% calories from protein · 1.7 g fiber · 0.1 g sugar per 100 g.
Composite of energy density (Rolls et al., 1999), protein & fiber satiety, minus sugar. A calculated heuristic — ranks satiety-per-calorie, not a clinical measure.
Dietary load (calculated from USDA values)
Potential renal acid load. Positive = acid-forming, negative = alkaline-forming.
Sodium-to-potassium ratio: 0.07 (lower is better — aim for ≤ 1)
Sodium:potassium per WHO potassium guidance. Computed from USDA nutrients.