

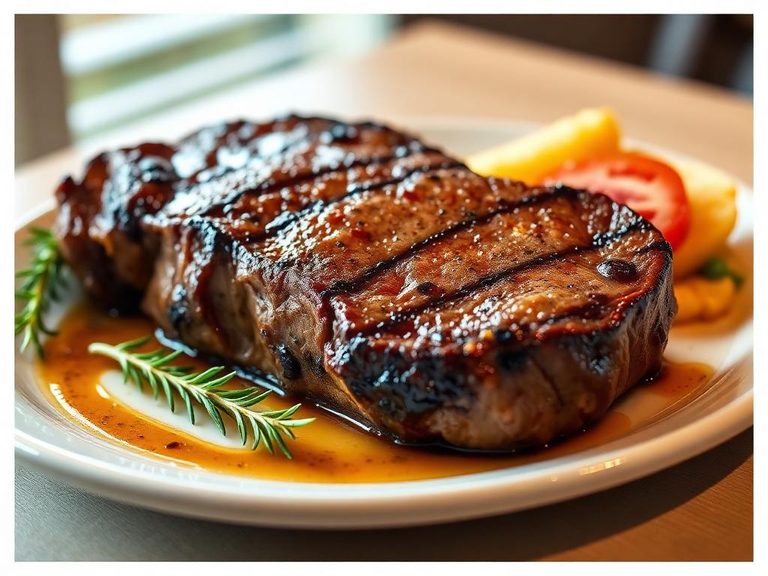
Beef, short loin, t-bone steak, separable lean and fat, trimmed to 1/8" fat, all grades, raw
Whole food · Beef Products

Photo: Wikipedia
The T-bone steak is a premium cut from the short loin, featuring the iconic T-shaped vertebra that divides two distinct muscles: the larger, beefy strip loin and the smaller, tender filet mignon. Its flavor is deeply beefy and rich, with a satisfying texture that combines the robust chew of the strip with the buttery tenderness of the filet. Nutritionally, it's a powerhouse of high-quality protein and provides essential fats, including monounsaturated fats and conjugated linoleic acid (CLA).
Calorie split: 37% protein · 0% carbs · 63% fat
↓ Full nutrition💚 Why it's loved
People love the T-bone for its dramatic presentation and the best-of-both-worlds experience of enjoying two prized steak textures from a single, flavorful piece. It's a celebratory centerpiece in steakhouses and home grills, symbolizing a hearty, indulgent meal.
⚠️ Watch-outs & how to enjoy it better
The significant fat content, while flavorful, increases calorie density and saturated fat intake. For those monitoring fat or cholesterol, it should be enjoyed in moderation. Tip: Trim the external fat cap before cooking and pair with large portions of non-starchy vegetables to create a balanced plate and enhance satiety.
Key benefits
- Excellent source of complete, high-quality protein for muscle maintenance and growth.
- Rich in essential minerals like zinc, iron (heme iron), and selenium.
- Provides B vitamins, especially B12, crucial for nerve function and red blood cell formation.
- Contains conjugated linoleic acid (CLA), a fatty acid studied for potential health benefits.
- The T-bone format offers two distinct textures and flavors in one cut.
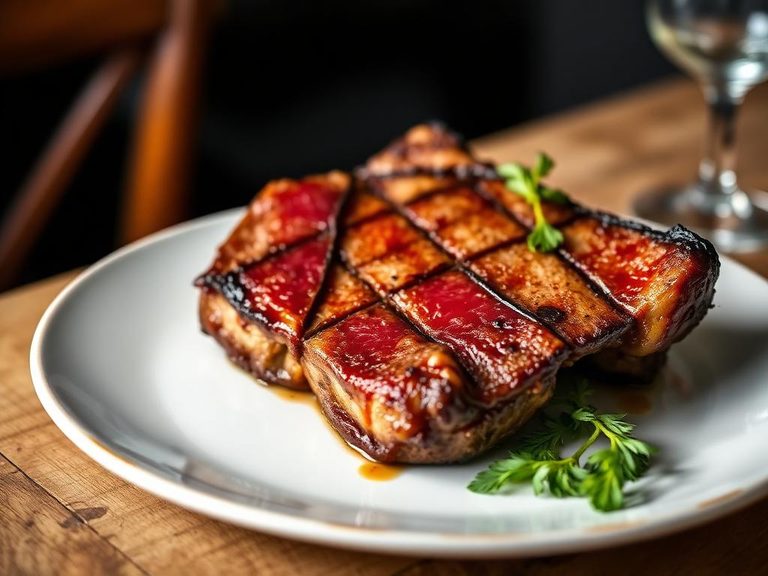
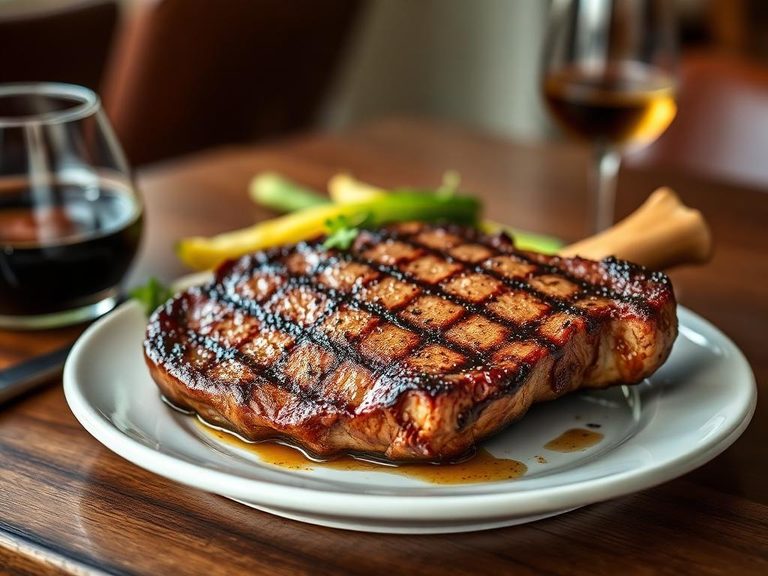
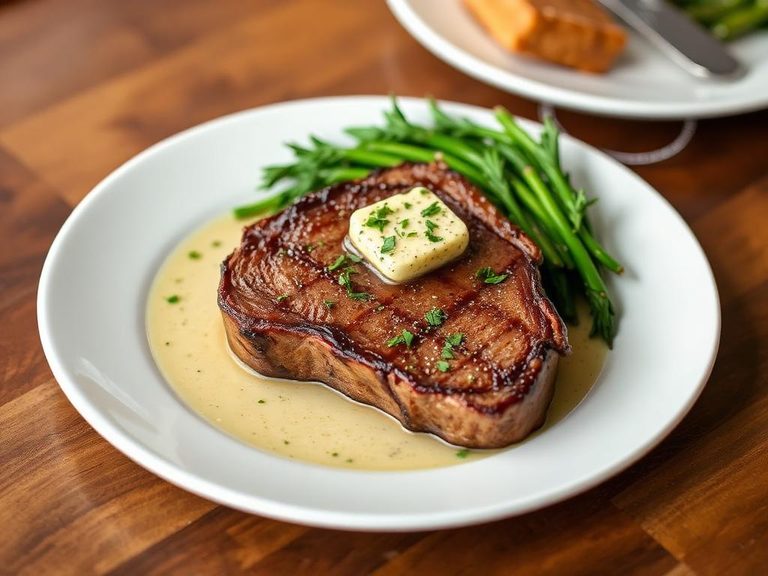
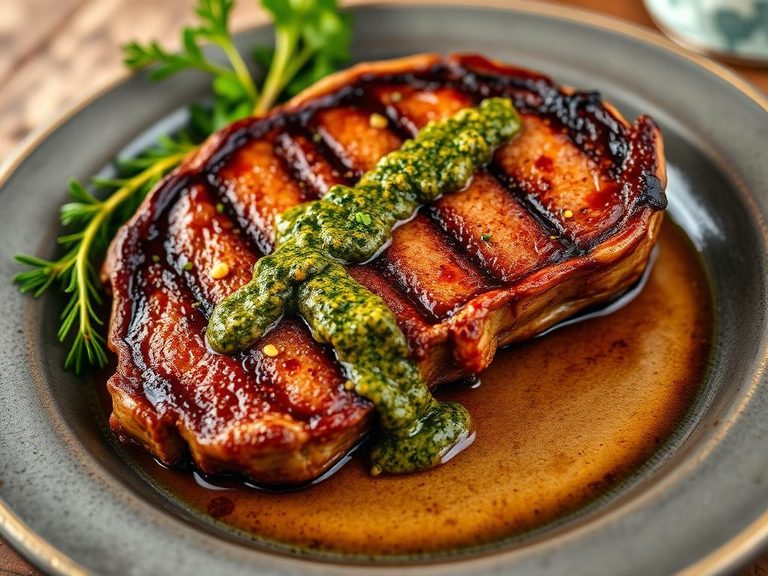
🍽️ Popular dishes
🌍 Where it's eaten
💡 Did you know?
The 'T' in T-bone comes from the lumbar vertebra that is cut crosswise, and the size of the filet mignon side determines whether it's sold as a T-bone or the larger, more expensive Porterhouse steak.
Full nutrition (USDA data · scales with serving)
| Water | 64.1 g |
| Energy | 223 kcal |
| Energy | 932 kj |
| Protein | 20.1 g |
| Total lipid (fat) | 15.2 g |
| Ash | 0.92 g |
| Carbohydrate, by difference | 0.00 g |
| Fiber, total dietary | 0.00 g |
| Total Sugars | 0.00 g |
| Calcium, Ca | 21.0 mg |
| Iron, Fe | 1.6 mg |
| Magnesium, Mg | 10.0 mg |
| Phosphorus, P | 177 mg |
| Potassium, K | 232 mg |
| Sodium, Na | 40.0 mg |
| Zinc, Zn | 3.3 mg |
| Copper, Cu | 0.05 mg |
| Manganese, Mn | 0.00 mg |
| Selenium, Se | 20.0 ug |
| Vitamin C, total ascorbic acid | 0.00 mg |
| Thiamin | 0.05 mg |
| Riboflavin | 0.19 mg |
| Niacin | 5.2 mg |
| Vitamin B-6 | 0.57 mg |
| Folate, total | 3.0 ug |
| Folic acid | 0.00 ug |
| Folate, food | 3.0 ug |
| Folate, DFE | 3.0 ug |
| Choline, total | 52.0 mg |
| Betaine | 8.8 mg |
| Vitamin B-12 | 1.7 ug |
| Vitamin B-12, added | 0.00 ug |
| Vitamin A, RAE | 4.0 ug |
| Retinol | 4.0 ug |
| Carotene, beta | 0.00 ug |
| Carotene, alpha | 0.00 ug |
| Cryptoxanthin, beta | 0.00 ug |
| Vitamin A, IU | 15.0 iu |
| Lycopene | 0.00 ug |
| Lutein + zeaxanthin | 0.00 ug |
| Vitamin E (alpha-tocopherol) | 0.22 mg |
| Vitamin E, added | 0.00 mg |
| Vitamin D (D2 + D3), International Units | 5.0 iu |
| Vitamin D (D2 + D3) | 0.10 ug |
| Vitamin D3 (cholecalciferol) | 0.10 ug |
| Vitamin K (phylloquinone) | 1.6 ug |
| Alcohol, ethyl | 0.00 g |
| Caffeine | 0.00 mg |
| Theobromine | 0.00 mg |
Fat & fatty acid profile (per 100g)
| Fatty acids, total saturated | 6.5 g |
| SFA 4:0 | 0.00 g |
| SFA 6:0 | 0.00 g |
| SFA 8:0 | 0.00 g |
| SFA 10:0 | 0.01 g |
| SFA 12:0 | 0.01 g |
| SFA 14:0 | 0.45 g |
| SFA 15:0 | 0.07 g |
| SFA 16:0 | 3.6 g |
| SFA 17:0 | 0.18 g |
| SFA 18:0 | 2.2 g |
| SFA 20:0 | 0.01 g |
| SFA 24:0 | 0.00 g |
| Fatty acids, total monounsaturated | 7.1 g |
| MUFA 14:1 | 0.11 g |
| MUFA 16:1 | 0.53 g |
| MUFA 16:1 c | 0.49 g |
| MUFA 17:1 | 0.12 g |
| MUFA 18:1 | 6.3 g |
| MUFA 18:1 c | 5.5 g |
| MUFA 20:1 | 0.04 g |
| MUFA 22:1 | 0.00 g |
| Fatty acids, total polyunsaturated | 0.70 g |
| PUFA 18:2 | 0.59 g |
| PUFA 18:2 n-6 c,c | 0.43 g |
| PUFA 18:2 CLAs | 0.08 g |
| PUFA 18:3 | 0.03 g |
| PUFA 18:3 n-3 c,c,c (ALA) | 0.03 g |
| PUFA 18:4 | 0.00 g |
| PUFA 20:2 n-6 c,c | 0.01 g |
| PUFA 20:3 | 0.02 g |
| PUFA 20:3 n-6 | 0.02 g |
| PUFA 20:4 | 0.04 g |
| PUFA 20:5 n-3 (EPA) | 0.00 g |
| PUFA 22:5 n-3 (DPA) | 0.01 g |
| PUFA 22:6 n-3 (DHA) | 0.00 g |
| Fatty acids, total trans | 0.90 g |
| Fatty acids, total trans-monoenoic | 0.81 g |
| TFA 16:1 t | 0.05 g |
| TFA 18:1 t | 0.77 g |
| TFA 18:2 t not further defined | 0.09 g |
| Fatty acids, total trans-polyenoic | 0.09 g |
| Cholesterol | 62.0 mg |
Amino acid profile (per 100g)
| Tryptophan | 0.23 g |
| Threonine | 0.95 g |
| Isoleucine | 0.94 g |
| Leucine | 1.7 g |
| Lysine | 1.9 g |
| Methionine | 0.54 g |
| Cystine | 0.20 g |
| Phenylalanine | 0.81 g |
| Tyrosine | 0.75 g |
| Valine | 1.0 g |
| Arginine | 1.4 g |
| Histidine | 0.75 g |
| Alanine | 1.2 g |
| Aspartic acid | 2.0 g |
| Glutamic acid | 3.3 g |
| Glycine | 0.99 g |
| Proline | 0.90 g |
| Serine | 0.83 g |
| Hydroxyproline | 0.14 g |
FAQ
What's the difference between a T-bone and a Porterhouse?
They are the same cut from the short loin. The USDA defines a Porterhouse as having a tenderloin section at least 1.25 inches wide at its widest point, while a T-bone's tenderloin is smaller.
What's the best way to cook a T-bone steak?
A high-heat method like grilling or pan-searing followed by a brief rest is ideal. The goal is a deep brown crust on the outside while reaching your desired doneness (medium-rare is often recommended for optimal tenderness) on the inside.
Is the fat on a T-bone steak healthy?
It contains a mix of saturated and monounsaturated fats. While monounsaturated fats are considered heart-healthy, the overall high fat content means it's best enjoyed as part of a balanced diet, not as an everyday staple.
Nutrient density (calculated · NRF9.3)
Nutrient Rich Foods index: beneficial nutrients (protein, fiber, vitamins, minerals) minus saturated fat, added sugar & sodium, per 100 kcal.
NRF9.3 index — Fulgoni, Keast & Drewnowski, 2009. Computed from USDA nutrients.
Weight-loss friendliness (composite index)
Energy density 2.23 kcal/g · 36% calories from protein · 0.0 g fiber · 0.0 g sugar per 100 g.
Composite of energy density (Rolls et al., 1999), protein & fiber satiety, minus sugar. A calculated heuristic — ranks satiety-per-calorie, not a clinical measure.
Dietary load (calculated from USDA values)
Potential renal acid load. Positive = acid-forming, negative = alkaline-forming.
Sodium-to-potassium ratio: 0.17 (lower is better — aim for ≤ 1)
Sodium:potassium per WHO potassium guidance. Computed from USDA nutrients.