

Beef, chuck, under blade center steak, boneless, Denver Cut, separable lean and fat, trimmed to 0" fat, all grades, raw
Whole food · Beef Products

Photo: Wikipedia
This is the lean, boneless Denver Cut from the chuck, a deep-lying muscle prized for its rich beefy flavor and surprisingly tender texture when sliced against the grain. With a protein content of nearly 19g per 100g and minimal fat, it's a powerhouse for muscle maintenance and satiety. Its low carbohydrate and sugar content makes it a staple in low-carb and ketogenic diets.
Calorie split: 42% protein · 1% carbs · 58% fat
↓ Full nutrition💚 Why it's loved
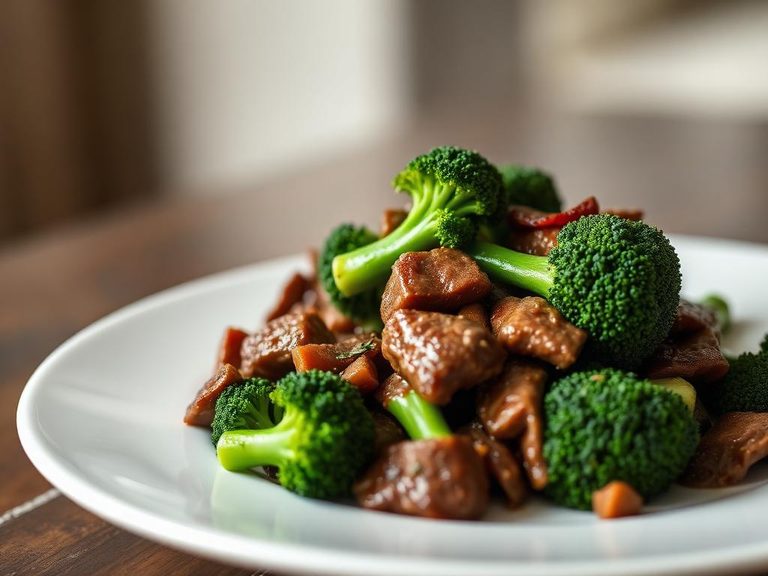
Chefs and home cooks adore the Denver Cut for its robust, beefy flavor that stands up to bold marinades and seasonings, while remaining tender enough for quick cooking. Its versatility shines from the grill to the skillet, making it a favorite for everything from simple weeknight steaks to hearty stir-fries.
⚠️ Watch-outs & how to enjoy it better
While lean, this cut can become tough and chewy if overcooked or sliced incorrectly, as its muscle fibers are dense. To counteract this, always slice thinly against the grain after cooking and consider a quick marinade with a acidic component (like citrus or vinegar) to help break down fibers before cooking.
Key benefits
- Excellent source of high-quality protein for muscle repair
- Very low in carbohydrates and sugars
- Rich in essential minerals like zinc and iron
- Provides B vitamins for energy metabolism
- Lean cut supports a high-protein, lower-fat diet
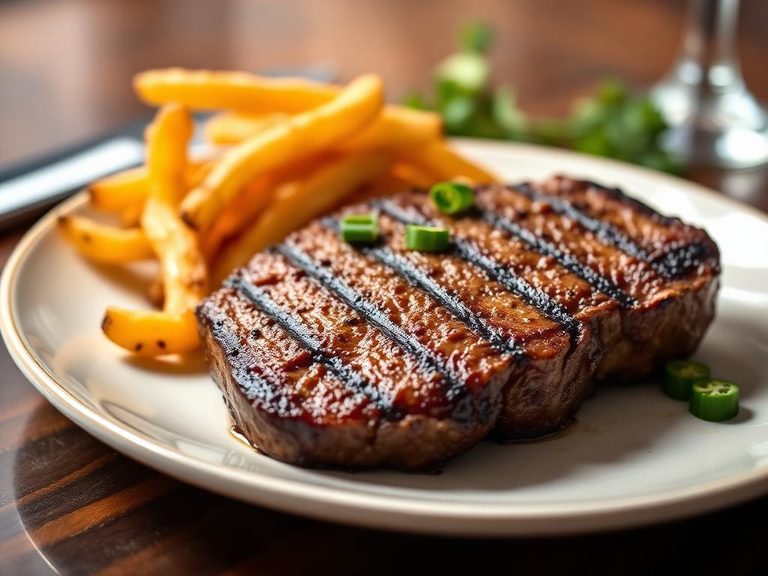
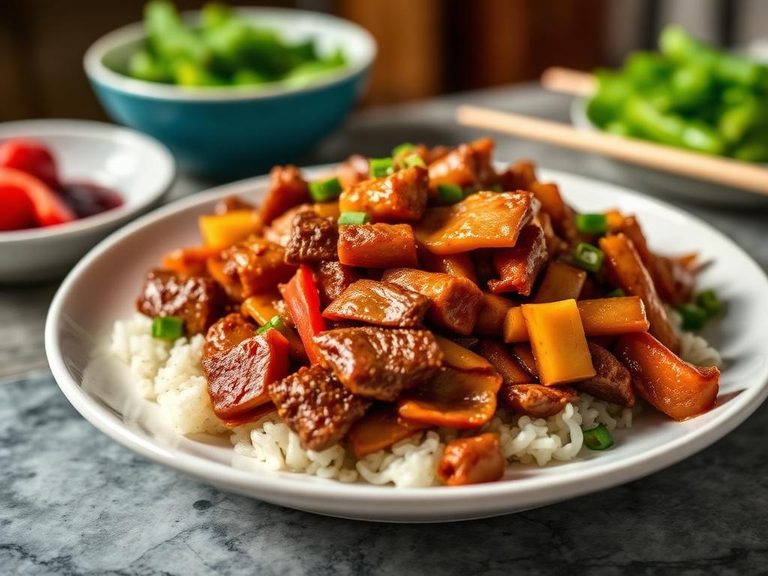
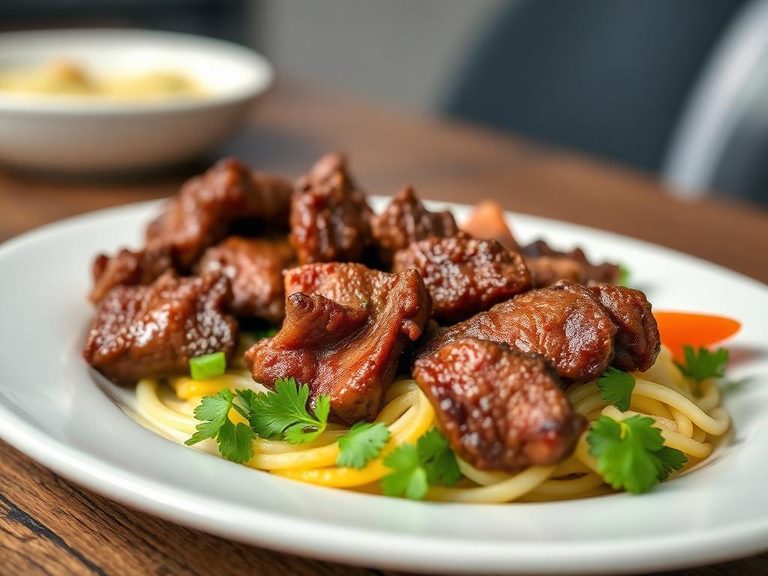
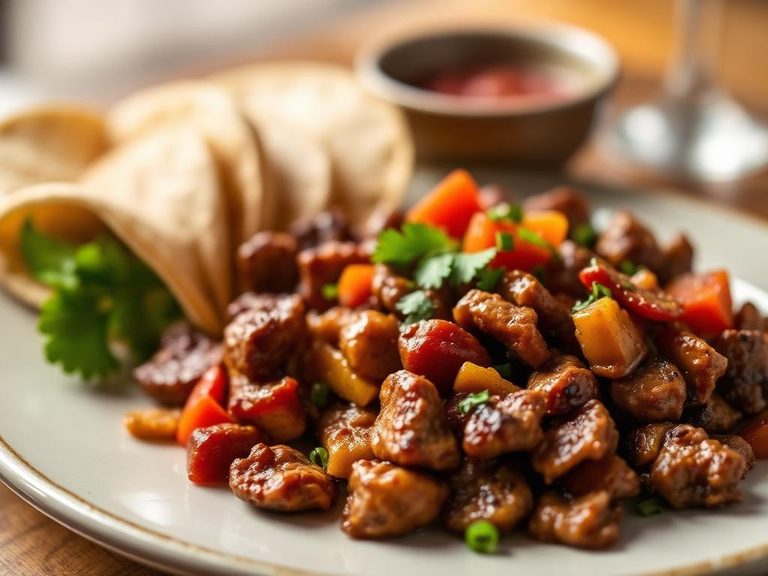
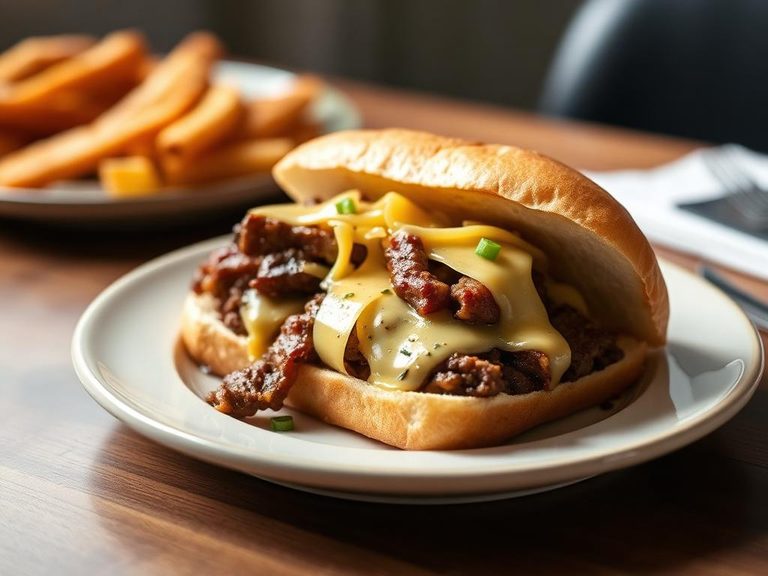
🍽️ Popular dishes
🌍 Where it's eaten
💡 Did you know?
The Denver Cut is a relatively modern steak name, popularized in the early 2000s by the beef industry to give a marketable identity to a delicious but previously overlooked muscle from the chuck.
Full nutrition (USDA data · scales with serving)
| Water | 68.1 g |
| Energy | 182 kcal |
| Energy | 762 kj |
| Protein | 19.0 g |
| Total lipid (fat) | 11.6 g |
| Ash | 0.90 g |
| Carbohydrate, by difference | 0.36 g |
| Fiber, total dietary | 0.00 g |
| Total Sugars | 0.00 g |
| Calcium, Ca | 11.0 mg |
| Iron, Fe | 2.4 mg |
| Magnesium, Mg | 20.0 mg |
| Phosphorus, P | 178 mg |
| Potassium, K | 315 mg |
| Sodium, Na | 76.0 mg |
| Zinc, Zn | 7.4 mg |
| Copper, Cu | 0.07 mg |
| Manganese, Mn | 0.01 mg |
| Selenium, Se | 21.2 ug |
| Vitamin C, total ascorbic acid | 0.00 mg |
| Thiamin | 0.08 mg |
| Riboflavin | 0.19 mg |
| Niacin | 3.3 mg |
| Pantothenic acid | 0.79 mg |
| Vitamin B-6 | 0.40 mg |
| Folate, total | 3.0 ug |
| Folic acid | 0.00 ug |
| Folate, food | 3.0 ug |
| Folate, DFE | 3.0 ug |
| Choline, total | 69.8 mg |
| Betaine | 20.8 mg |
| Vitamin B-12 | 3.0 ug |
| Vitamin B-12, added | 0.00 ug |
| Vitamin A, RAE | 4.0 ug |
| Retinol | 4.0 ug |
| Carotene, beta | 0.00 ug |
| Carotene, alpha | 0.00 ug |
| Cryptoxanthin, beta | 0.00 ug |
| Vitamin A, IU | 13.0 iu |
| Lycopene | 0.00 ug |
| Lutein + zeaxanthin | 0.00 ug |
| Vitamin E (alpha-tocopherol) | 0.14 mg |
| Vitamin E, added | 0.00 mg |
| Vitamin D (D2 + D3), International Units | 4.0 iu |
| Vitamin D (D2 + D3) | 0.10 ug |
| Vitamin D3 (cholecalciferol) | 0.10 ug |
| Vitamin K (phylloquinone) | 1.5 ug |
| Alcohol, ethyl | 0.00 g |
| Caffeine | 0.00 mg |
| Theobromine | 0.00 mg |
Fat & fatty acid profile (per 100g)
| Fatty acids, total saturated | 4.8 g |
| SFA 4:0 | 0.00 g |
| SFA 6:0 | 0.00 g |
| SFA 8:0 | 0.00 g |
| SFA 10:0 | 0.00 g |
| SFA 12:0 | 0.00 g |
| SFA 14:0 | 0.32 g |
| SFA 16:0 | 2.6 g |
| SFA 17:0 | 0.15 g |
| SFA 18:0 | 1.7 g |
| SFA 20:0 | 0.00 g |
| SFA 24:0 | 0.01 g |
| Fatty acids, total monounsaturated | 5.6 g |
| MUFA 14:1 | 0.07 g |
| MUFA 16:1 | 0.36 g |
| MUFA 16:1 c | 0.36 g |
| MUFA 17:1 | 0.11 g |
| MUFA 18:1 | 5.1 g |
| MUFA 18:1 c | 4.4 g |
| MUFA 18:1-11 t (18:1t n-7) | 0.44 g |
| MUFA 20:1 | 0.02 g |
| MUFA 22:1 | 0.00 g |
| Fatty acids, total polyunsaturated | 0.58 g |
| PUFA 18:2 | 0.50 g |
| PUFA 18:2 n-6 c,c | 0.46 g |
| PUFA 18:2 CLAs | 0.05 g |
| PUFA 18:3 | 0.02 g |
| PUFA 18:3 n-3 c,c,c (ALA) | 0.02 g |
| PUFA 18:4 | 0.00 g |
| PUFA 20:2 n-6 c,c | 0.00 g |
| PUFA 20:4 | 0.05 g |
| PUFA 20:5 n-3 (EPA) | 0.00 g |
| PUFA 22:5 n-3 (DPA) | 0.00 g |
| PUFA 22:6 n-3 (DHA) | 0.00 g |
| Fatty acids, total trans | 0.73 g |
| Fatty acids, total trans-monoenoic | 0.73 g |
| TFA 18:1 t | 0.73 g |
| Cholesterol | 69.0 mg |
Amino acid profile (per 100g)
| Tryptophan | 0.21 g |
| Threonine | 0.83 g |
| Isoleucine | 0.81 g |
| Leucine | 1.5 g |
| Lysine | 1.7 g |
| Methionine | 0.54 g |
| Cystine | 0.20 g |
| Phenylalanine | 0.72 g |
| Tyrosine | 0.66 g |
| Valine | 0.86 g |
| Arginine | 1.3 g |
| Histidine | 0.61 g |
| Alanine | 1.1 g |
| Aspartic acid | 1.7 g |
| Glutamic acid | 3.0 g |
| Glycine | 0.87 g |
| Proline | 0.78 g |
| Serine | 0.73 g |
| Hydroxyproline | 0.13 g |
FAQ
What is the best way to cook a Denver Cut steak?
High-heat methods like grilling or pan-searing are ideal. Cook to medium-rare or medium (130-145°F internal temp) to preserve tenderness, then let it rest for 5-10 minutes before slicing thinly against the grain.
Is the Denver Cut the same as a Flat Iron steak?
No, they are different muscles from the chuck. The Denver Cut comes from the serratus ventralis muscle, while the Flat Iron comes from the top blade. Both are tender chuck steaks, but the Denver Cut is typically a bit leaner and has a more uniform shape.
How does the nutrition compare to a Ribeye or Sirloin?
The Denver Cut is significantly leaner than a Ribeye, with much less marbling and fat. It is nutritionally closer to a Sirloin, offering a similar high-protein, low-fat profile, but often at a more affordable price point.
Nutrient density (calculated · NRF9.3)
Nutrient Rich Foods index: beneficial nutrients (protein, fiber, vitamins, minerals) minus saturated fat, added sugar & sodium, per 100 kcal.
NRF9.3 index — Fulgoni, Keast & Drewnowski, 2009. Computed from USDA nutrients.
Weight-loss friendliness (composite index)
Energy density 1.82 kcal/g · 42% calories from protein · 0.0 g fiber · 0.0 g sugar per 100 g.
Composite of energy density (Rolls et al., 1999), protein & fiber satiety, minus sugar. A calculated heuristic — ranks satiety-per-calorie, not a clinical measure.
Dietary load (calculated from USDA values)
Potential renal acid load. Positive = acid-forming, negative = alkaline-forming.
Sodium-to-potassium ratio: 0.24 (lower is better — aim for ≤ 1)
Sodium:potassium per WHO potassium guidance. Computed from USDA nutrients.