

Pie, Dutch Apple, Commercially Prepared
Whole food · Baked Products

Photo: Wikipedia
This is a commercially prepared Dutch apple pie, featuring a sweet, spiced apple filling beneath a crumbly, buttery streusel topping instead of a traditional pastry crust. Each bite offers a satisfying contrast between the soft, tender fruit and the crunchy, oat-like topping, with a pronounced sweetness balanced by warm cinnamon notes. At 290 calories per 100g, it's a calorie-dense treat where the majority of energy comes from carbohydrates (44.54g), primarily from sugar (22.02g).
Calorie split: 3% protein · 61% carbs · 36% fat
↓ Full nutrition💚 Why it's loved
People adore Dutch apple pie for its comforting, nostalgic flavor and the textural contrast between the soft apple filling and the crunchy streusel topping. It's a versatile dessert that pairs beautifully with a scoop of vanilla ice cream or a dollop of whipped cream, making it a staple at family gatherings and holiday meals.
⚠️ Watch-outs & how to enjoy it better
The high sugar content (22.02g per 100g) can cause rapid blood-sugar spikes, making it a concern for those managing diabetes or insulin resistance. To mitigate this, pair a smaller portion with protein-rich foods like Greek yogurt or nuts, and choose a slice with a higher apple-to-streusel ratio. Commercial versions may also contain preservatives or added sodium, so checking labels is wise for those with sensitivities.
Key benefits
- Provides quick energy from carbohydrates
- Contains some dietary fiber from apples (1.6g)
- Offers a comforting, familiar flavor profile
- Convenient ready-to-eat dessert option
- Source of small amounts of fat for satiety
🍽️ Popular dishes

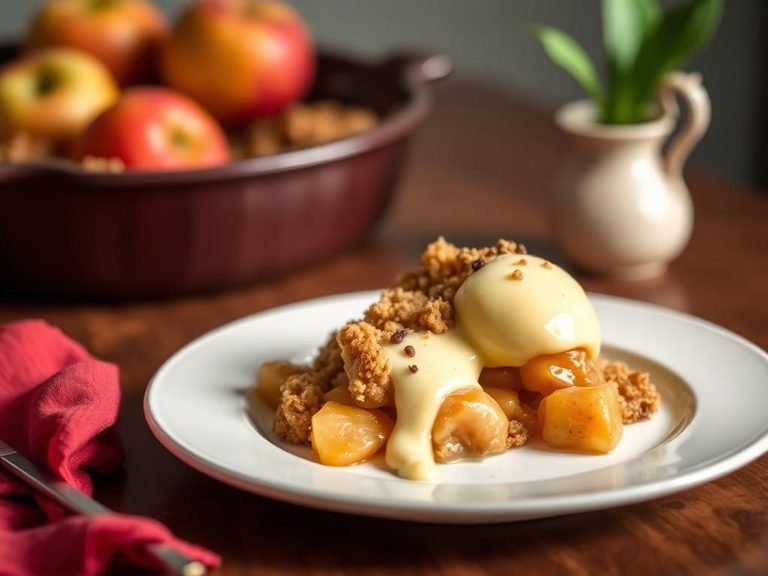

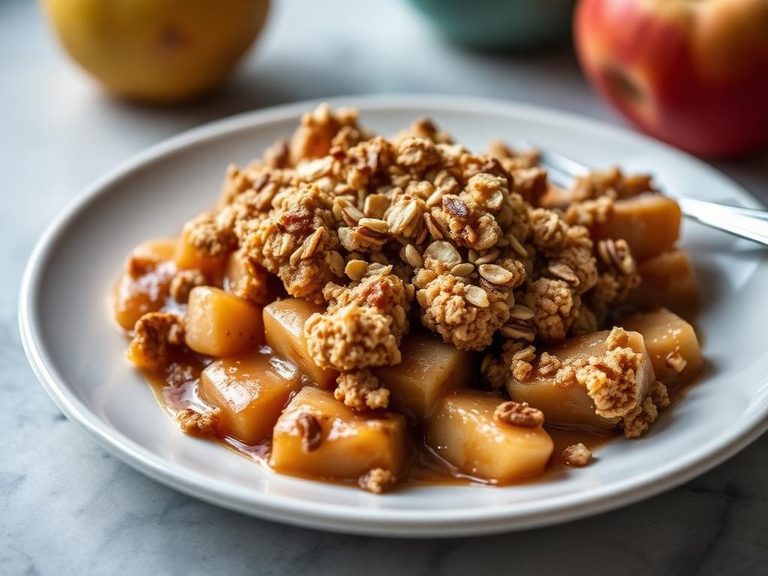
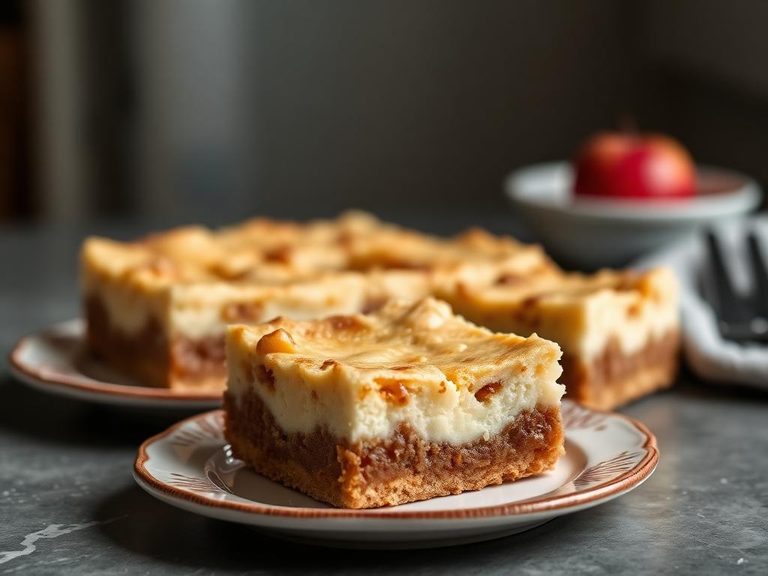
🌍 Where it's eaten
💡 Did you know?
The 'Dutch' in Dutch apple pie doesn't refer to the Netherlands, but to the Pennsylvania Dutch (Deutsch) immigrants who popularized the streusel-topped version in the United States, adapting their traditional German apple cake recipes.
Full nutrition (USDA data · scales with serving)
| Water | 41.1 g |
| Energy | 290 kcal |
| Energy | 1215 kj |
| Protein | 2.2 g |
| Total lipid (fat) | 11.5 g |
| Ash | 0.70 g |
| Carbohydrate, by difference | 44.5 g |
| Fiber, total dietary | 1.6 g |
| Total Sugars | 22.0 g |
| Sucrose | 11.0 g |
| Glucose | 4.9 g |
| Fructose | 4.6 g |
| Lactose | 0.00 g |
| Maltose | 1.5 g |
| Starch | 15.4 g |
| Calcium, Ca | 14.0 mg |
| Iron, Fe | 0.91 mg |
| Magnesium, Mg | 8.0 mg |
| Phosphorus, P | 29.0 mg |
| Potassium, K | 76.0 mg |
| Sodium, Na | 200 mg |
| Zinc, Zn | 0.19 mg |
| Copper, Cu | 0.15 mg |
| Manganese, Mn | 0.23 mg |
| Selenium, Se | 2.2 ug |
| Vitamin C, total ascorbic acid | 5.7 mg |
| Thiamin | 0.19 mg |
| Riboflavin | 0.07 mg |
| Niacin | 1.1 mg |
| Pantothenic acid | 0.10 mg |
| Vitamin B-6 | 0.04 mg |
| Folate, total | 21.0 ug |
| Folic acid | 15.0 ug |
| Folate, food | 6.0 ug |
| Folate, DFE | 32.0 ug |
| Choline, total | 17.0 mg |
| Betaine | 8.4 mg |
| Vitamin B-12 | 0.00 ug |
| Vitamin B-12, added | 0.00 ug |
| Vitamin A, RAE | 18.0 ug |
| Retinol | 17.0 ug |
| Carotene, beta | 10.0 ug |
| Carotene, alpha | 0.00 ug |
| Cryptoxanthin, beta | 11.0 ug |
| Vitamin A, IU | 82.0 iu |
| Lycopene | 1.0 ug |
| Lutein + zeaxanthin | 42.0 ug |
| Vitamin E (alpha-tocopherol) | 0.96 mg |
| Vitamin E, added | 0.00 mg |
| Tocopherol, beta | 0.07 mg |
| Tocopherol, gamma | 4.9 mg |
| Tocopherol, delta | 1.6 mg |
| Tocotrienol, alpha | 0.02 mg |
| Tocotrienol, beta | 0.00 mg |
| Tocotrienol, gamma | 0.00 mg |
| Tocotrienol, delta | 0.00 mg |
| Vitamin K (phylloquinone) | 16.4 ug |
| Vitamin K (Menaquinone-4) | 0.90 ug |
| Alcohol, ethyl | 0.00 g |
| Caffeine | 0.00 mg |
| Theobromine | 0.00 mg |
Fat & fatty acid profile (per 100g)
| Fatty acids, total saturated | 2.3 g |
| SFA 4:0 | 0.00 g |
| SFA 6:0 | 0.00 g |
| SFA 8:0 | 0.00 g |
| SFA 10:0 | 0.00 g |
| SFA 12:0 | 0.00 g |
| SFA 14:0 | 0.00 g |
| SFA 15:0 | 0.00 g |
| SFA 16:0 | 1.2 g |
| SFA 17:0 | 0.00 g |
| SFA 18:0 | 1.0 g |
| SFA 20:0 | 0.02 g |
| SFA 22:0 | 0.03 g |
| SFA 24:0 | 0.00 g |
| Fatty acids, total monounsaturated | 5.8 g |
| MUFA 14:1 | 0.00 g |
| MUFA 15:1 | 0.00 g |
| MUFA 16:1 | 0.00 g |
| MUFA 17:1 | 0.00 g |
| MUFA 18:1 | 5.8 g |
| MUFA 20:1 | 0.00 g |
| MUFA 22:1 | 0.00 g |
| MUFA 24:1 c | 0.00 g |
| Fatty acids, total polyunsaturated | 2.1 g |
| PUFA 18:2 | 2.0 g |
| PUFA 18:3 | 0.12 g |
| PUFA 18:4 | 0.00 g |
| PUFA 20:2 n-6 c,c | 0.00 g |
| PUFA 20:3 | 0.00 g |
| PUFA 20:4 | 0.00 g |
| PUFA 20:5 n-3 (EPA) | 0.00 g |
| PUFA 21:5 | 0.00 g |
| PUFA 22:4 | 0.00 g |
| PUFA 22:5 n-3 (DPA) | 0.00 g |
| PUFA 22:6 n-3 (DHA) | 0.00 g |
| Cholesterol | 0.00 mg |
Amino acid profile (per 100g)
| Tryptophan | 0.03 g |
| Threonine | 0.06 g |
| Isoleucine | 0.08 g |
| Leucine | 0.16 g |
| Lysine | 0.04 g |
| Methionine | 0.05 g |
| Cystine | 0.06 g |
| Phenylalanine | 0.10 g |
| Tyrosine | 0.05 g |
| Valine | 0.10 g |
| Arginine | 0.08 g |
| Histidine | 0.05 g |
| Alanine | 0.07 g |
| Aspartic acid | 0.12 g |
| Glutamic acid | 0.74 g |
| Glycine | 0.08 g |
| Proline | 0.25 g |
| Serine | 0.10 g |
FAQ
What makes Dutch apple pie different from regular apple pie?
Dutch apple pie is distinguished by its crumbly streusel topping (made with flour, butter, and sugar, sometimes with oats) instead of a traditional pastry crust on top. The filling is similar, but the topping gives it a different texture and flavor.
Is commercially prepared Dutch apple pie healthier than homemade?
Not necessarily. Commercial versions often contain more added sugars, preservatives, and sometimes higher sodium to extend shelf life. Homemade allows control over ingredients, but both can be high in calories and sugar.
How can I reduce the sugar in Dutch apple pie?
You can use less sugar in the filling, choose naturally sweeter apple varieties like Honeycrisp or Fuji, and reduce the sugar in the streusel topping. Adding a squeeze of lemon juice can also enhance sweetness perception without adding sugar.
What are common allergens in Dutch apple pie?
Common allergens include wheat (from flour), dairy (from butter or milk in the topping), and sometimes nuts (if added to the streusel). Always check labels for specific allergens.
Nutrient density (calculated · NRF9.3)
Nutrient Rich Foods index: beneficial nutrients (protein, fiber, vitamins, minerals) minus saturated fat, added sugar & sodium, per 100 kcal.
NRF9.3 index — Fulgoni, Keast & Drewnowski, 2009. Computed from USDA nutrients.
Weight-loss friendliness (composite index)
Energy density 2.90 kcal/g · 3% calories from protein · 1.6 g fiber · 22.0 g sugar per 100 g.
Composite of energy density (Rolls et al., 1999), protein & fiber satiety, minus sugar. A calculated heuristic — ranks satiety-per-calorie, not a clinical measure.
Dietary load (calculated from USDA values)
Potential renal acid load. Positive = acid-forming, negative = alkaline-forming.
Sodium-to-potassium ratio: 2.63 (lower is better — aim for ≤ 1)
Sodium:potassium per WHO potassium guidance. Computed from USDA nutrients.