

Peaches, canned, heavy syrup, drained
Whole food · Fruits and Fruit Juices
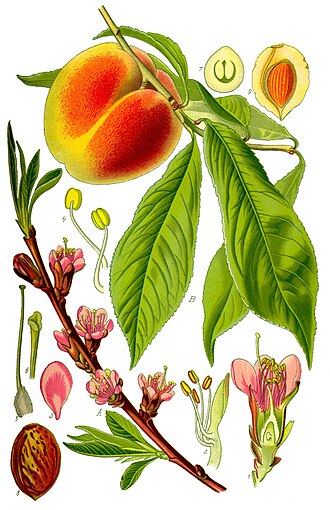
Photo: Wikipedia
Canned peaches in heavy syrup are sweet, tender, and uniformly soft, with a glossy, syrupy sheen that amplifies their natural stone-fruit flavor. They deliver a quick energy boost with 18.43g of carbohydrates per 100g, primarily from added sugar, and are a convenient pantry staple for desserts and snacks. The draining process reduces the syrup load, but they remain a distinctly sweet, processed fruit product.
Calorie split: 3% protein · 95% carbs · 2% fat
↓ Full nutrition💚 Why it's loved
People love them for their consistently sweet, nostalgic flavor and soft, melt-in-your-mouth texture, which makes them a comforting addition to desserts, oatmeal, or yogurt. Their long shelf life and ready-to-eat nature make them a reliable and versatile ingredient in home cooking.
⚠️ Watch-outs & how to enjoy it better
The high sugar content (14.66g per 100g) can cause blood-sugar spikes, making them less suitable for those managing diabetes or watching their sugar intake. To counteract this, pair them with protein (like Greek yogurt or nuts) or healthy fats (like chia seeds) to slow sugar absorption, and practice portion control by limiting servings to ½ cup or less.
Key benefits
- Provides a quick source of energy from natural and added sugars
- Offers a small amount of dietary fiber (1.2g per 100g)
- Convenient, shelf-stable, and available year-round
- Contains vitamin C and potassium, though in lower amounts than fresh
- Easy to digest for those with sensitive stomachs
🍽️ Popular dishes


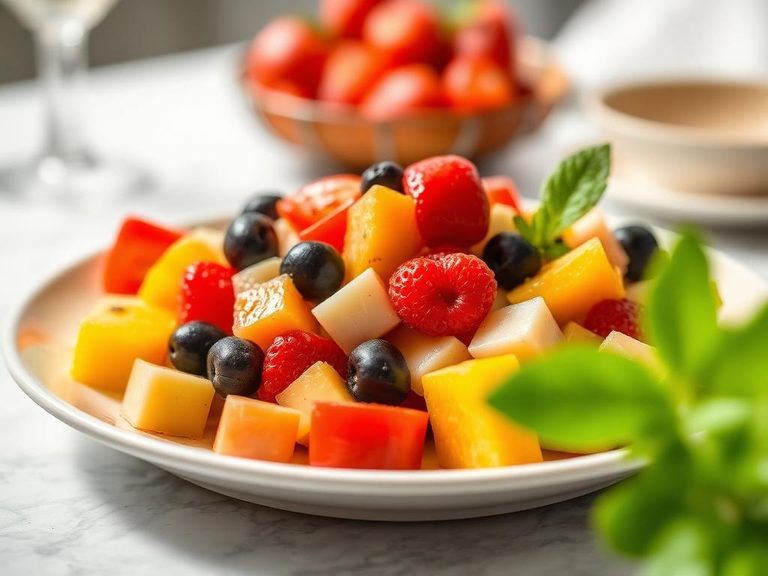

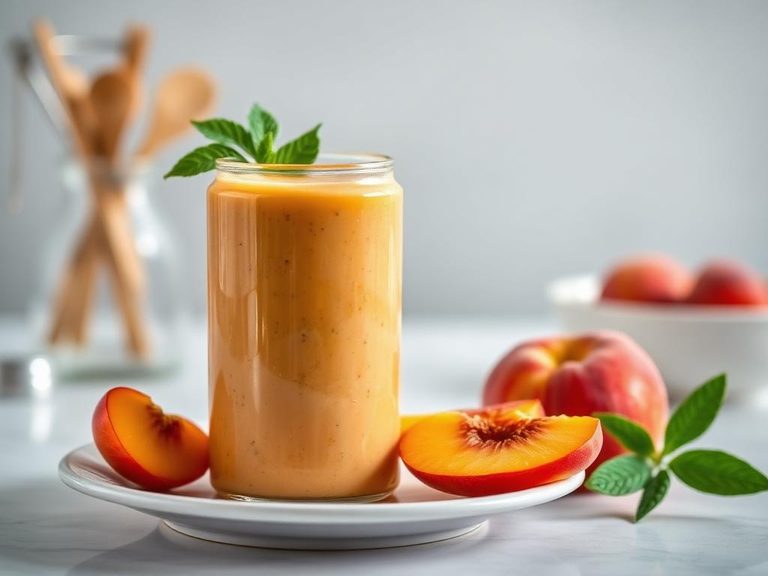
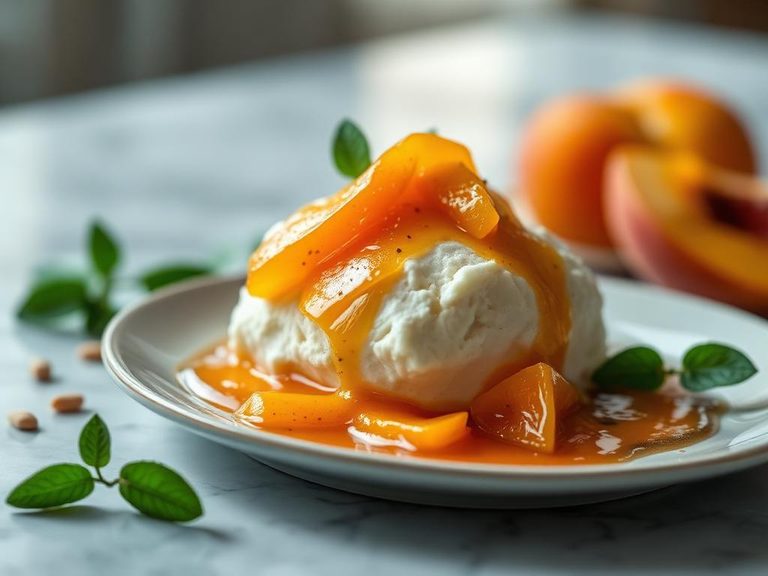
🌍 Where it's eaten
💡 Did you know?
Canned peaches were one of the first fruits to be commercially canned in the United States, with the process invented by Nicolas Appert in the early 19th century.
Full nutrition (USDA data · scales with serving)
| Water | 80.6 g |
| Energy | 72.0 kcal |
| Energy | 303 kj |
| Protein | 0.52 g |
| Total lipid (fat) | 0.18 g |
| Ash | 0.26 g |
| Carbohydrate, by difference | 18.4 g |
| Fiber, total dietary | 1.2 g |
| Total Sugars | 14.7 g |
| Sucrose | 4.0 g |
| Glucose | 5.8 g |
| Fructose | 3.5 g |
| Lactose | 0.00 g |
| Maltose | 1.4 g |
| Galactose | 0.00 g |
| Calcium, Ca | 3.0 mg |
| Iron, Fe | 0.27 mg |
| Magnesium, Mg | 5.0 mg |
| Phosphorus, P | 12.0 mg |
| Potassium, K | 94.0 mg |
| Sodium, Na | 6.0 mg |
| Zinc, Zn | 0.09 mg |
| Copper, Cu | 0.06 mg |
| Selenium, Se | 0.00 ug |
| Fluoride, F | 6.8 ug |
| Vitamin C, total ascorbic acid | 0.70 mg |
| Thiamin | 0.02 mg |
| Riboflavin | 0.02 mg |
| Niacin | 0.63 mg |
| Pantothenic acid | 0.02 mg |
| Vitamin B-6 | 0.01 mg |
| Folate, total | 9.0 ug |
| Folic acid | 0.00 ug |
| Folate, food | 9.0 ug |
| Folate, DFE | 9.0 ug |
| Choline, total | 3.8 mg |
| Betaine | 0.30 mg |
| Vitamin B-12 | 0.00 ug |
| Vitamin B-12, added | 0.00 ug |
| Vitamin A, RAE | 31.0 ug |
| Retinol | 0.00 ug |
| Carotene, beta | 333 ug |
| Carotene, alpha | 0.00 ug |
| Cryptoxanthin, beta | 85.0 ug |
| Vitamin A, IU | 626 iu |
| Lycopene | 0.00 ug |
| Lutein + zeaxanthin | 33.0 ug |
| Vitamin E (alpha-tocopherol) | 1.2 mg |
| Vitamin E, added | 0.00 mg |
| Tocopherol, beta | 0.00 mg |
| Tocopherol, gamma | 0.04 mg |
| Tocopherol, delta | 0.00 mg |
| Tocotrienol, alpha | 0.00 mg |
| Tocotrienol, beta | 0.00 mg |
| Tocotrienol, gamma | 0.00 mg |
| Tocotrienol, delta | 0.00 mg |
| Vitamin D (D2 + D3), International Units | 0.00 iu |
| Vitamin D (D2 + D3) | 0.00 ug |
| Vitamin K (phylloquinone) | 2.4 ug |
| Vitamin K (Dihydrophylloquinone) | 0.00 ug |
| Alcohol, ethyl | 0.00 g |
| Caffeine | 0.00 mg |
| Theobromine | 0.00 mg |
Fat & fatty acid profile (per 100g)
| Fatty acids, total saturated | 0.01 g |
| SFA 4:0 | 0.00 g |
| SFA 6:0 | 0.00 g |
| SFA 8:0 | 0.00 g |
| SFA 10:0 | 0.00 g |
| SFA 12:0 | 0.00 g |
| SFA 14:0 | 0.00 g |
| SFA 16:0 | 0.01 g |
| SFA 18:0 | 0.00 g |
| Fatty acids, total monounsaturated | 0.05 g |
| MUFA 16:1 | 0.00 g |
| MUFA 18:1 | 0.05 g |
| MUFA 20:1 | 0.00 g |
| MUFA 22:1 | 0.00 g |
| Fatty acids, total polyunsaturated | 0.07 g |
| PUFA 18:2 | 0.07 g |
| PUFA 18:3 | 0.00 g |
| PUFA 18:4 | 0.00 g |
| PUFA 20:4 | 0.00 g |
| PUFA 20:5 n-3 (EPA) | 0.00 g |
| PUFA 22:5 n-3 (DPA) | 0.00 g |
| PUFA 22:6 n-3 (DHA) | 0.00 g |
| Fatty acids, total trans | 0.00 g |
| Cholesterol | 0.00 mg |
Amino acid profile (per 100g)
| Tryptophan | 0.01 g |
| Threonine | 0.01 g |
| Isoleucine | 0.01 g |
| Leucine | 0.02 g |
| Lysine | 0.02 g |
| Methionine | 0.01 g |
| Cystine | 0.01 g |
| Phenylalanine | 0.01 g |
| Tyrosine | 0.01 g |
| Valine | 0.01 g |
| Arginine | 0.01 g |
| Histidine | 0.01 g |
| Alanine | 0.02 g |
| Aspartic acid | 0.24 g |
| Glutamic acid | 0.03 g |
| Glycine | 0.01 g |
| Proline | 0.01 g |
| Serine | 0.02 g |
FAQ
Are canned peaches in heavy syrup as healthy as fresh peaches?
No, they are higher in added sugar and lower in some nutrients like vitamin C, but they still provide fiber and some vitamins. Fresh peaches are generally more nutritious.
How can I reduce the sugar content of canned peaches?
Drain the syrup thoroughly and rinse the peaches with water. You can also look for canned peaches in light syrup or juice, or use fresh or frozen peaches instead.
Can I use canned peaches in cooking and baking?
Yes, they are excellent in pies, cobblers, smoothies, and salads. Their soft texture makes them easy to incorporate into recipes.
Nutrient density (calculated · NRF9.3)
Nutrient Rich Foods index: beneficial nutrients (protein, fiber, vitamins, minerals) minus saturated fat, added sugar & sodium, per 100 kcal.
NRF9.3 index — Fulgoni, Keast & Drewnowski, 2009. Computed from USDA nutrients.
Weight-loss friendliness (composite index)
Energy density 0.72 kcal/g · 3% calories from protein · 1.2 g fiber · 14.7 g sugar per 100 g.
Composite of energy density (Rolls et al., 1999), protein & fiber satiety, minus sugar. A calculated heuristic — ranks satiety-per-calorie, not a clinical measure.
Dietary load (calculated from USDA values)
Potential renal acid load. Positive = acid-forming, negative = alkaline-forming.
Sodium-to-potassium ratio: 0.06 (lower is better — aim for ≤ 1)
Sodium:potassium per WHO potassium guidance. Computed from USDA nutrients.