

Kale, frozen, cooked, boiled, drained, with salt
Whole food · Vegetables and Vegetable Products

Photo: Wikipedia
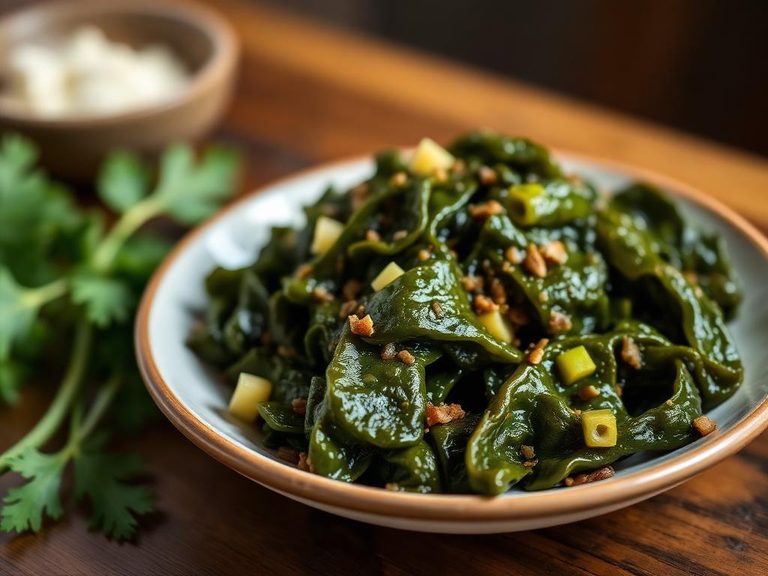
This is kale that has been frozen, boiled until tender, and drained, with a touch of salt added to preserve its vibrant green color and enhance its earthy, slightly bitter flavor. The cooking process softens its tough leaves into a silky, melt-in-your-mouth texture while concentrating its nutrients. It's a nutrient-dense powerhouse, offering a significant amount of protein and fiber for very few calories.
Calorie split: 27% protein · 48% carbs · 25% fat
↓ Full nutrition💚 Why it's loved
People love it for its deep, savory umami flavor that serves as a robust base for soups, stews, and casseroles, and its incredible versatility—it can be blended into smoothies, stirred into pasta, or enjoyed as a simple side dish. It's a staple in health-conscious kitchens and traditional cuisines alike, valued for making meals both hearty and nutritious.
⚠️ Watch-outs & how to enjoy it better
The primary downside is the added sodium from the salt, which can be a concern for those monitoring blood pressure. The natural oxalates in kale can also affect mineral absorption for some individuals. To counteract the sodium, rinse the kale briefly under cool water before use or choose a no-salt-added version. To reduce oxalates, the boiling process already helps, and pairing it with a calcium-rich food like cheese or yogurt can mitigate any impact on mineral absorption.
Key benefits
- Excellent source of vitamins K, A, and C
- High in fiber for digestive health
- Good plant-based protein source
- Rich in antioxidants like lutein and zeaxanthin
- Low in calories and carbohydrates
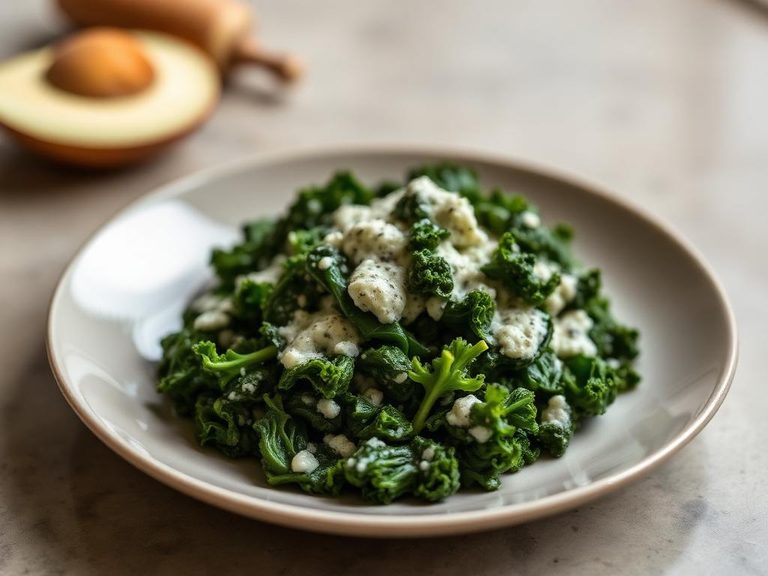
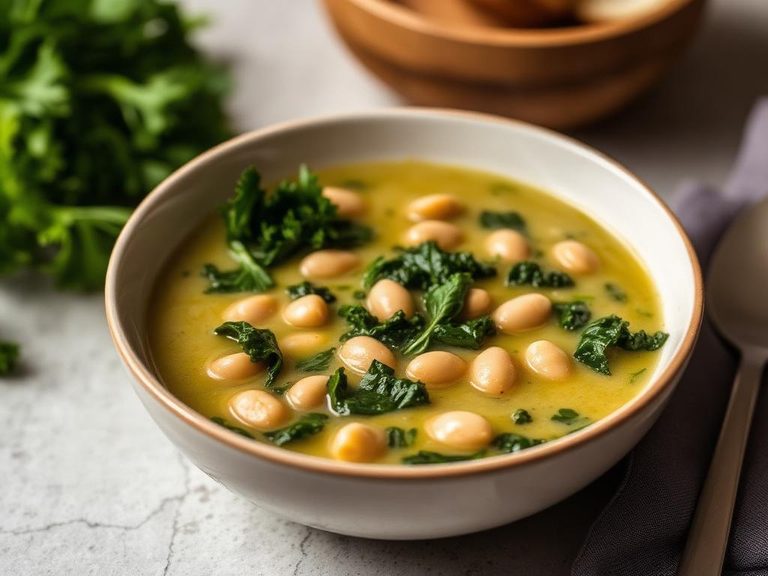
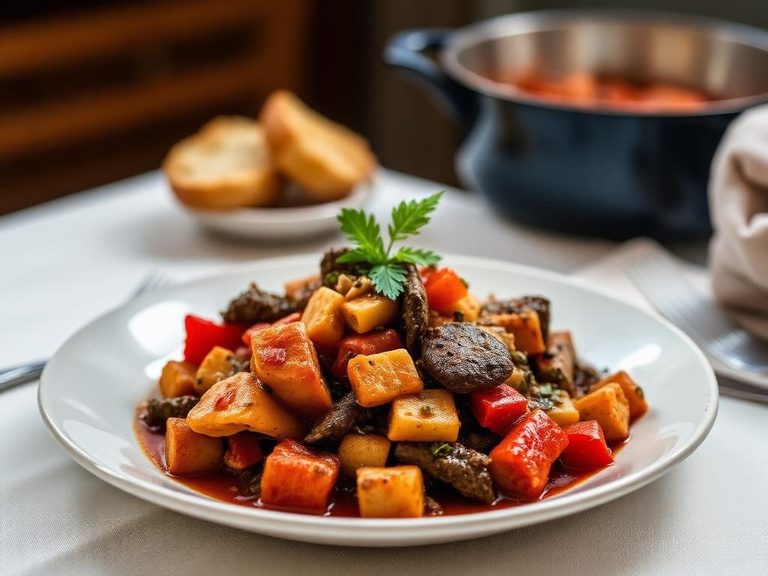
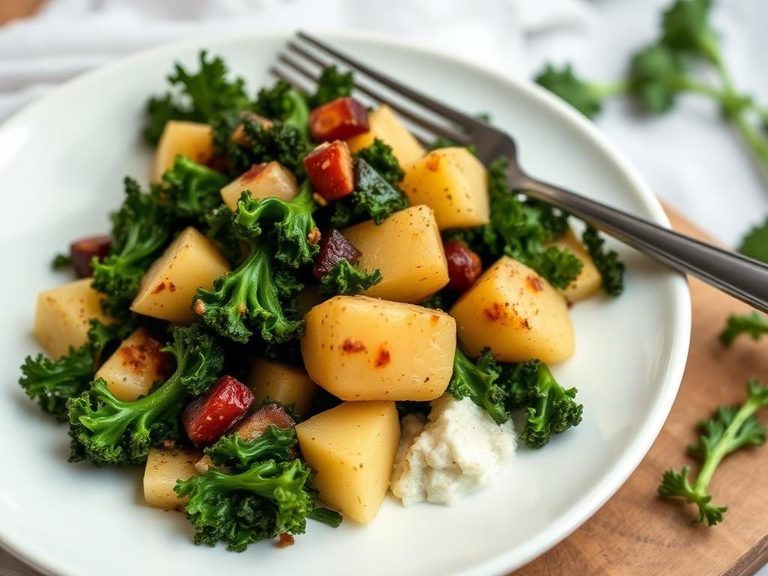
🍽️ Popular dishes
🌍 Where it's eaten
💡 Did you know?
Kale is a member of the cabbage family (Brassica oleracea), making it a close relative of broccoli, cauliflower, and Brussels sprouts—all different cultivars of the same species.
Full nutrition (USDA data · scales with serving)
| Water | 89.8 g |
| Energy | 36.0 kcal |
| Energy | 151 kj |
| Protein | 2.9 g |
| Total lipid (fat) | 1.2 g |
| Ash | 0.73 g |
| Carbohydrate, by difference | 5.3 g |
| Fiber, total dietary | 2.3 g |
| Total Sugars | 1.2 g |
| Sucrose | 0.25 g |
| Glucose | 0.54 g |
| Fructose | 0.42 g |
| Lactose | 0.00 g |
| Maltose | 0.00 g |
| Galactose | 0.00 g |
| Calcium, Ca | 150 mg |
| Iron, Fe | 0.84 mg |
| Magnesium, Mg | 25.0 mg |
| Phosphorus, P | 42.0 mg |
| Potassium, K | 144 mg |
| Sodium, Na | 252 mg |
| Zinc, Zn | 0.27 mg |
| Copper, Cu | 0.07 mg |
| Manganese, Mn | 0.54 mg |
| Selenium, Se | 1.0 ug |
| Vitamin C, total ascorbic acid | 17.8 mg |
| Thiamin | 0.06 mg |
| Riboflavin | 0.14 mg |
| Niacin | 0.46 mg |
| Pantothenic acid | 0.17 mg |
| Vitamin B-6 | 0.06 mg |
| Folate, total | 65.0 ug |
| Folic acid | 0.00 ug |
| Folate, food | 65.0 ug |
| Folate, DFE | 65.0 ug |
| Choline, total | 0.50 mg |
| Betaine | 0.30 mg |
| Vitamin B-12 | 0.00 ug |
| Vitamin B-12, added | 0.00 ug |
| Vitamin A, RAE | 146 ug |
| Retinol | 0.00 ug |
| Carotene, beta | 1731 ug |
| Carotene, alpha | 10.0 ug |
| Cryptoxanthin, beta | 26.0 ug |
| Vitamin A, IU | 2915 iu |
| Lycopene | 0.00 ug |
| Lutein + zeaxanthin | 4983 ug |
| Vitamin E (alpha-tocopherol) | 1.6 mg |
| Vitamin E, added | 0.00 mg |
| Tocopherol, beta | 0.00 mg |
| Tocopherol, gamma | 0.12 mg |
| Tocopherol, delta | 0.00 mg |
| Tocotrienol, alpha | 0.00 mg |
| Tocotrienol, beta | 0.00 mg |
| Tocotrienol, gamma | 0.00 mg |
| Tocotrienol, delta | 0.00 mg |
| Vitamin D (D2 + D3), International Units | 0.00 iu |
| Vitamin D (D2 + D3) | 0.00 ug |
| Vitamin K (phylloquinone) | 419 ug |
| Vitamin K (Dihydrophylloquinone) | 0.00 ug |
| Vitamin K (Menaquinone-4) | 0.00 ug |
| Alcohol, ethyl | 0.00 g |
| Caffeine | 0.00 mg |
| Theobromine | 0.00 mg |
Fat & fatty acid profile (per 100g)
| Fatty acids, total saturated | 0.16 g |
| SFA 4:0 | 0.00 g |
| SFA 6:0 | 0.00 g |
| SFA 8:0 | 0.00 g |
| SFA 10:0 | 0.00 g |
| SFA 12:0 | 0.01 g |
| SFA 14:0 | 0.01 g |
| SFA 16:0 | 0.14 g |
| SFA 18:0 | 0.01 g |
| Fatty acids, total monounsaturated | 0.09 g |
| MUFA 16:1 | 0.00 g |
| MUFA 18:1 | 0.09 g |
| MUFA 20:1 | 0.00 g |
| MUFA 22:1 | 0.00 g |
| Fatty acids, total polyunsaturated | 0.60 g |
| PUFA 18:2 | 0.26 g |
| PUFA 18:3 | 0.34 g |
| PUFA 18:4 | 0.00 g |
| PUFA 20:4 | 0.00 g |
| PUFA 20:5 n-3 (EPA) | 0.00 g |
| PUFA 22:5 n-3 (DPA) | 0.00 g |
| PUFA 22:6 n-3 (DHA) | 0.00 g |
| Fatty acids, total trans | 0.00 g |
| Cholesterol | 0.00 mg |
Amino acid profile (per 100g)
| Tryptophan | 0.04 g |
| Threonine | 0.13 g |
| Isoleucine | 0.18 g |
| Leucine | 0.20 g |
| Lysine | 0.18 g |
| Methionine | 0.03 g |
| Cystine | 0.04 g |
| Phenylalanine | 0.15 g |
| Tyrosine | 0.10 g |
| Valine | 0.16 g |
| Arginine | 0.16 g |
| Histidine | 0.17 g |
| Alanine | 0.15 g |
| Aspartic acid | 0.26 g |
| Glutamic acid | 0.33 g |
| Glycine | 0.14 g |
| Proline | 0.17 g |
| Serine | 0.12 g |
FAQ
How does freezing and boiling affect kale's nutrition?
Freezing preserves most vitamins and minerals. Boiling can cause some water-soluble vitamins (like C and B vitamins) to leach into the water, but it also makes other nutrients like beta-carotene more bioavailable and reduces oxalate content.
Is frozen kale as good as fresh?
For cooked applications like soups, stews, or casseroles, frozen kale is often more convenient and can be more nutrient-consistent, as it's typically blanched and frozen at peak freshness. Fresh kale is better for raw dishes like salads.
Why is salt added to frozen cooked kale?
A small amount of salt is often added as a preservative to help retain the kale's bright green color, maintain texture, and enhance its natural savory flavor during the freezing process.
Nutrient density (calculated · NRF9.3)
Nutrient Rich Foods index: beneficial nutrients (protein, fiber, vitamins, minerals) minus saturated fat, added sugar & sodium, per 100 kcal.
NRF9.3 index — Fulgoni, Keast & Drewnowski, 2009. Computed from USDA nutrients.
Weight-loss friendliness (composite index)
Energy density 0.36 kcal/g · 33% calories from protein · 2.3 g fiber · 1.2 g sugar per 100 g.
Composite of energy density (Rolls et al., 1999), protein & fiber satiety, minus sugar. A calculated heuristic — ranks satiety-per-calorie, not a clinical measure.
Dietary load (calculated from USDA values)
Potential renal acid load. Positive = acid-forming, negative = alkaline-forming.
Sodium-to-potassium ratio: 1.75 (lower is better — aim for ≤ 1)
Sodium:potassium per WHO potassium guidance. Computed from USDA nutrients.