

Snack, Mixed Berry Bar
Whole food · Snacks

Photo: Wikipedia
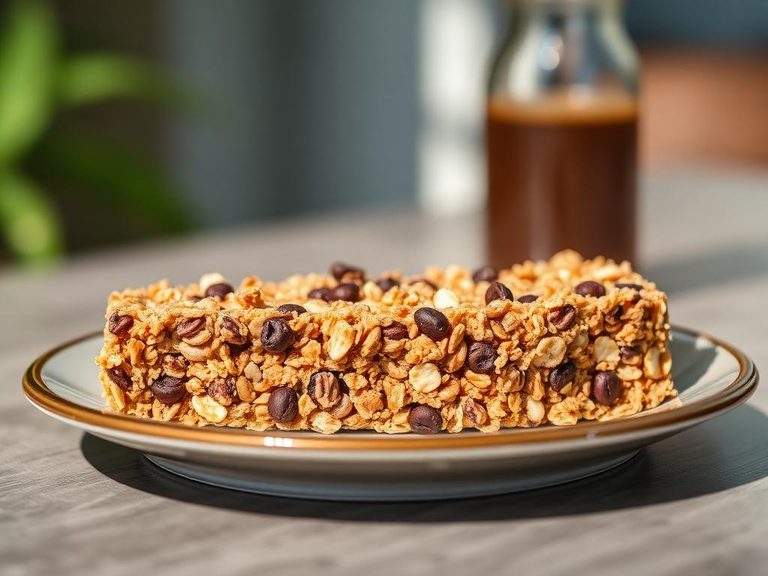
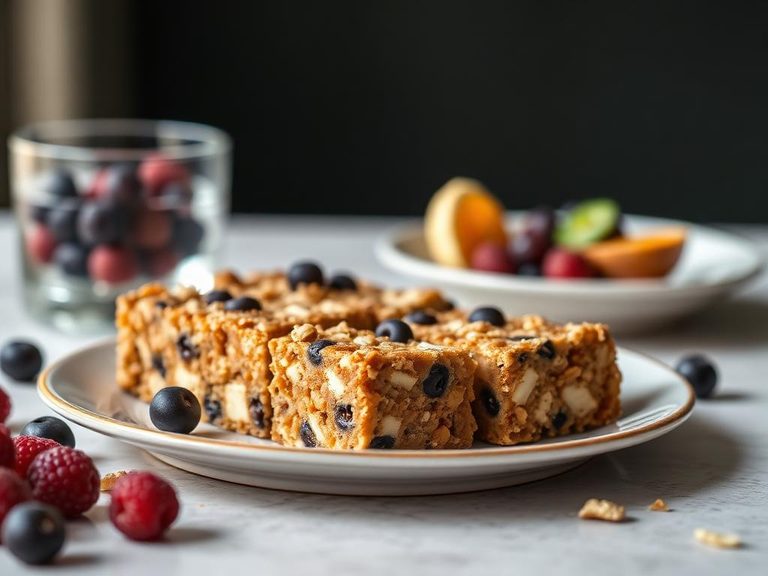
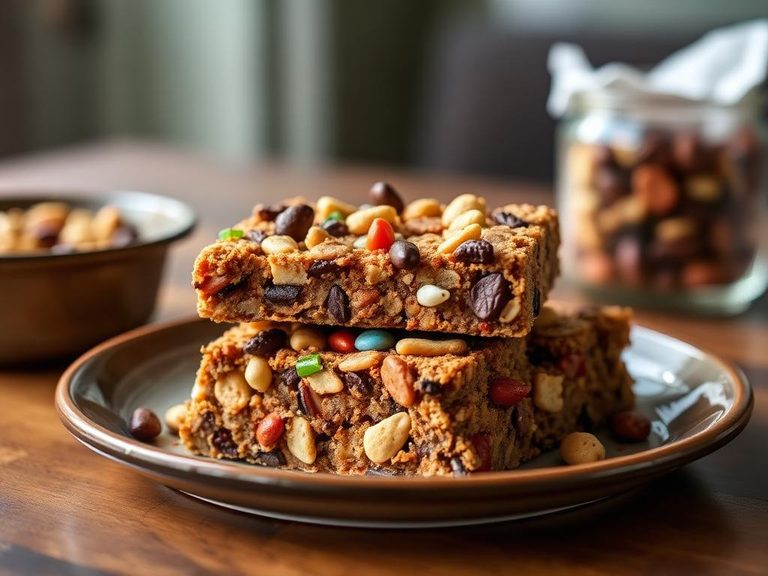
A dense, chewy snack bar packed with a medley of berries—think raspberries, blueberries, and strawberries—blended with oats, nuts, and a touch of honey or syrup for binding. Its texture is satisfyingly firm with a sweet-tart berry punch and a subtle nuttiness from the base. With 13.16g protein and 7.9g fiber per 100g, it’s a surprisingly substantial option for a quick energy boost.
Calorie split: 14% protein · 61% carbs · 25% fat
↓ Full nutrition💚 Why it's loved
People love it for the burst of fruity sweetness paired with a hearty, chewy texture that feels indulgent yet wholesome. It’s a go-to for hikers, busy professionals, and anyone craving a satisfying snack that doesn’t skimp on flavor or substance.
⚠️ Watch-outs & how to enjoy it better
The 26.32g sugar per 100g can cause blood-sugar spikes if eaten alone, especially for those with insulin sensitivity. To mitigate this, pair it with a source of fat or protein (like Greek yogurt or a handful of almonds) and stick to a single bar (around 118g) to manage intake.
Key benefits
- High protein content for a snack bar (13.16g/100g) supports muscle maintenance
- Good fiber source (7.9g/100g) aids digestion and promotes fullness
- Berries provide antioxidants like anthocyanins and vitamin C
- Balanced macronutrient profile with complex carbs from oats and natural sugars from fruit
- Portable and shelf-stable for on-the-go nutrition
🍽️ Popular dishes
🌍 Where it's eaten
💡 Did you know?
The first commercial fruit and nut bars were marketed in the 1960s as 'health food' for outdoor enthusiasts, but they didn't gain mainstream popularity until the 1990s when they were rebranded as convenient, on-the-go snacks for urban lifestyles.
Full nutrition (USDA data · scales with serving)
| Water | 15.5 g |
| Energy | 383 kcal |
| Energy | 1601 kj |
| Protein | 13.2 g |
| Total lipid (fat) | 10.5 g |
| Ash | 2.0 g |
| Carbohydrate, by difference | 58.8 g |
| Fiber, total dietary | 7.9 g |
| Total Sugars | 26.3 g |
| Calcium, Ca | 105 mg |
| Iron, Fe | 1.9 mg |
| Magnesium, Mg | 91.0 mg |
| Phosphorus, P | 343 mg |
| Potassium, K | 446 mg |
| Sodium, Na | 447 mg |
| Zinc, Zn | 2.6 mg |
| Copper, Cu | 0.24 mg |
| Manganese, Mn | 2.0 mg |
| Selenium, Se | 19.8 ug |
| Fluoride, F | 11.5 ug |
| Vitamin C, total ascorbic acid | 0.60 mg |
| Thiamin | 0.28 mg |
| Riboflavin | 0.28 mg |
| Niacin | 0.86 mg |
| Pantothenic acid | 1.1 mg |
| Vitamin B-6 | 0.12 mg |
| Folate, total | 28.0 ug |
| Folic acid | 0.00 ug |
| Folate, food | 28.0 ug |
| Folate, DFE | 28.0 ug |
| Choline, total | 39.8 mg |
| Betaine | 0.20 mg |
| Vitamin B-12 | 0.51 ug |
| Vitamin B-12, added | 0.00 ug |
| Vitamin A, RAE | 27.0 ug |
| Retinol | 26.0 ug |
| Carotene, beta | 6.0 ug |
| Carotene, alpha | 0.00 ug |
| Cryptoxanthin, beta | 0.00 ug |
| Vitamin A, IU | 97.0 iu |
| Lycopene | 0.00 ug |
| Lutein + zeaxanthin | 104 ug |
| Vitamin E (alpha-tocopherol) | 0.29 mg |
| Vitamin E, added | 0.00 mg |
| Tocopherol, beta | 0.02 mg |
| Tocopherol, gamma | 0.07 mg |
| Tocopherol, delta | 0.00 mg |
| Tocotrienol, alpha | 0.62 mg |
| Tocotrienol, beta | 0.00 mg |
| Tocotrienol, gamma | 0.00 mg |
| Tocotrienol, delta | 0.00 mg |
| Vitamin D (D2 + D3), International Units | 2.0 iu |
| Vitamin D (D2 + D3) | 0.10 ug |
| Vitamin D2 (ergocalciferol) | 0.00 ug |
| Vitamin D3 (cholecalciferol) | 0.10 ug |
| Vitamin K (phylloquinone) | 1.6 ug |
| Vitamin K (Dihydrophylloquinone) | 0.00 ug |
| Vitamin K (Menaquinone-4) | 0.00 ug |
| Alcohol, ethyl | 0.00 g |
| Caffeine | 0.00 mg |
| Theobromine | 0.00 mg |
Fat & fatty acid profile (per 100g)
| Fatty acids, total saturated | 3.8 g |
| SFA 4:0 | 0.14 g |
| SFA 6:0 | 0.10 g |
| SFA 8:0 | 0.07 g |
| SFA 10:0 | 0.14 g |
| SFA 12:0 | 0.19 g |
| SFA 14:0 | 0.53 g |
| SFA 15:0 | 0.00 g |
| SFA 16:0 | 2.1 g |
| SFA 17:0 | 0.00 g |
| SFA 18:0 | 0.54 g |
| SFA 20:0 | 0.00 g |
| SFA 22:0 | 0.00 g |
| SFA 24:0 | 0.00 g |
| Fatty acids, total monounsaturated | 2.9 g |
| MUFA 14:1 | 0.00 g |
| MUFA 15:1 | 0.00 g |
| MUFA 16:1 | 0.12 g |
| MUFA 17:1 | 0.00 g |
| MUFA 18:1 | 2.8 g |
| MUFA 20:1 | 0.00 g |
| MUFA 22:1 | 0.00 g |
| MUFA 24:1 c | 0.00 g |
| Fatty acids, total polyunsaturated | 2.1 g |
| PUFA 18:2 | 1.9 g |
| PUFA 18:3 | 0.13 g |
| PUFA 18:4 | 0.00 g |
| PUFA 20:2 n-6 c,c | 0.00 g |
| PUFA 20:3 | 0.00 g |
| PUFA 20:4 | 0.00 g |
| PUFA 20:5 n-3 (EPA) | 0.00 g |
| PUFA 22:4 | 0.00 g |
| PUFA 22:5 n-3 (DPA) | 0.00 g |
| PUFA 22:6 n-3 (DHA) | 0.00 g |
| Fatty acids, total trans | 0.00 g |
| Cholesterol | 0.00 mg |
Amino acid profile (per 100g)
Estimated from Snacks, corn-based, extruded, chips, plain — USDA does not publish this profile for Snack.
| Tryptophan | 0.05 g |
| Threonine | 0.25 g |
| Isoleucine | 0.23 g |
| Leucine | 0.80 g |
| Lysine | 0.18 g |
| Methionine | 0.14 g |
| Cystine | 0.12 g |
| Phenylalanine | 0.32 g |
| Tyrosine | 0.27 g |
| Valine | 0.33 g |
| Arginine | 0.33 g |
| Histidine | 0.20 g |
| Alanine | 0.49 g |
| Aspartic acid | 0.46 g |
| Glutamic acid | 1.2 g |
| Glycine | 0.27 g |
| Proline | 0.57 g |
| Serine | 0.31 g |
FAQ
Is a mixed berry bar a good post-workout snack?
Yes, its combination of protein (13.16g/100g) and carbohydrates (58.84g/100g) can help with muscle recovery and glycogen replenishment, though it’s best paired with a protein shake or milk for optimal recovery.
Can I eat this bar if I have a nut allergy?
Check the label carefully—many mixed berry bars contain almonds, cashews, or peanuts. If nuts are present, look for nut-free versions or opt for a fruit-and-oat-based bar instead.
How does the sugar content compare to other snacks?
At 26.32g sugar per 100g, it’s higher than a plain oat bar but lower than many candy bars or sweetened granola bars. The sugar comes mostly from fruit and added sweeteners, so it’s best enjoyed in moderation.
Nutrient density (calculated · NRF9.3)
Nutrient Rich Foods index: beneficial nutrients (protein, fiber, vitamins, minerals) minus saturated fat, added sugar & sodium, per 100 kcal.
NRF9.3 index — Fulgoni, Keast & Drewnowski, 2009. Computed from USDA nutrients.
Weight-loss friendliness (composite index)
Energy density 3.83 kcal/g · 14% calories from protein · 7.9 g fiber · 26.3 g sugar per 100 g.
Composite of energy density (Rolls et al., 1999), protein & fiber satiety, minus sugar. A calculated heuristic — ranks satiety-per-calorie, not a clinical measure.
Dietary load (calculated from USDA values)
Potential renal acid load. Positive = acid-forming, negative = alkaline-forming.
Sodium-to-potassium ratio: 1.00 (lower is better — aim for ≤ 1)
Sodium:potassium per WHO potassium guidance. Computed from USDA nutrients.