

Blueberries, canned, light syrup, drained
Whole food · Fruits and Fruit Juices

Photo: Wikipedia
These are whole blueberries preserved in a light sugar syrup, then drained, resulting in a tender, juicy berry with a sweet-tart flavor and a slightly softer texture than fresh. They offer a concentrated source of quick energy from their natural and added sugars, while retaining some of the fruit's characteristic deep purple hue and mild floral notes.
Calorie split: 4% protein · 92% carbs · 4% fat
↓ Full nutrition💚 Why it's loved
People love them for their consistent sweetness and soft, spoonable texture that blends seamlessly into yogurt, oatmeal, or pancake batter. They are a nostalgic pantry staple, evoking the comfort of classic American desserts and providing a reliable burst of berry flavor without seasonal constraints.
⚠️ Watch-outs & how to enjoy it better
The primary downside is the added sugar content, which can cause blood sugar spikes, especially for those managing diabetes. To counteract this, pair them with protein or fat (like Greek yogurt or nuts) to slow sugar absorption, practice portion control, or rinse them under water to remove some surface syrup. They are also a processed fruit product, so those avoiding added sugars should opt for fresh or frozen berries.
Key benefits
- Provides quick, accessible energy from carbohydrates.
- Contains dietary fiber to support digestive regularity.
- Offers a convenient, year-round source of fruit flavor.
- Retains some antioxidants like anthocyanins from the blueberry skin.
- Lighter in calories and sugar than heavy syrup varieties.
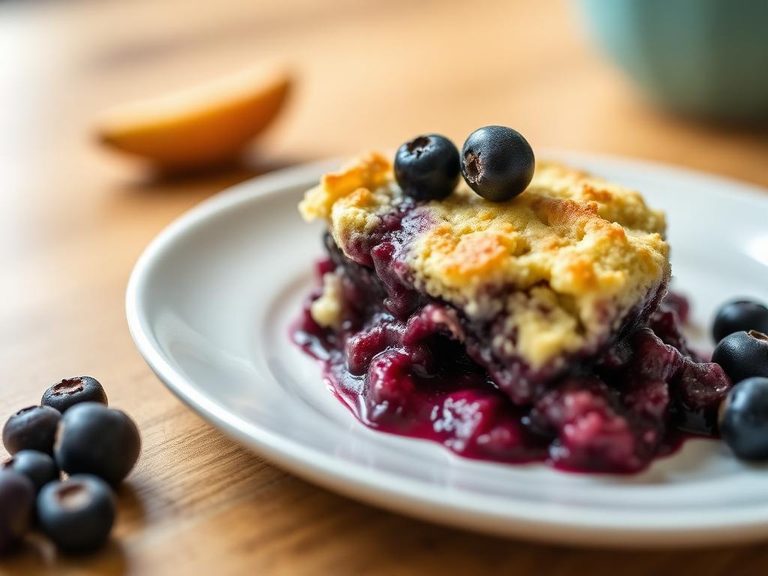
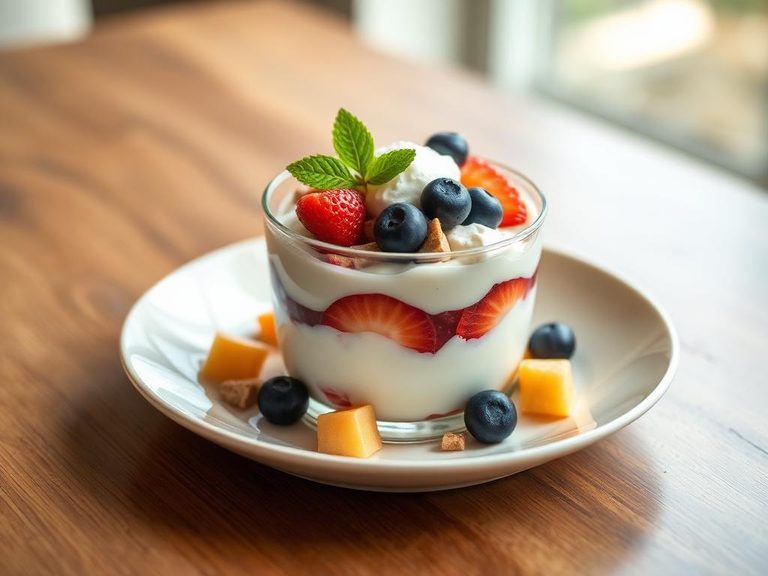
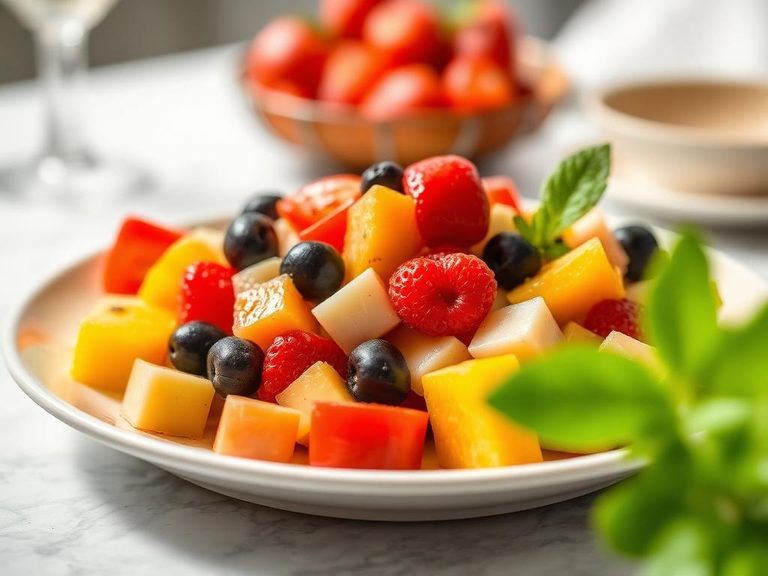
🍽️ Popular dishes



🌍 Where it's eaten
💡 Did you know?
The canning process for blueberries was heavily refined in the United States during the early 20th century, making them a key ingredient in military rations and a symbol of home-front cooking during World War II.
Full nutrition (USDA data · scales with serving)
| Water | 75.7 g |
| Energy | 88.0 kcal |
| Energy | 370 kj |
| Protein | 1.0 g |
| Total lipid (fat) | 0.40 g |
| Ash | 0.18 g |
| Carbohydrate, by difference | 22.7 g |
| Fiber, total dietary | 2.6 g |
| Total Sugars | 17.4 g |
| Sucrose | 0.41 g |
| Glucose | 8.6 g |
| Fructose | 8.4 g |
| Lactose | 0.00 g |
| Maltose | 0.00 g |
| Galactose | 0.00 g |
| Calcium, Ca | 6.0 mg |
| Iron, Fe | 0.43 mg |
| Magnesium, Mg | 4.0 mg |
| Phosphorus, P | 12.0 mg |
| Potassium, K | 54.0 mg |
| Sodium, Na | 3.0 mg |
| Zinc, Zn | 0.09 mg |
| Copper, Cu | 0.05 mg |
| Manganese, Mn | 0.44 mg |
| Selenium, Se | 0.10 ug |
| Vitamin C, total ascorbic acid | 0.50 mg |
| Thiamin | 0.05 mg |
| Riboflavin | 0.13 mg |
| Niacin | 0.36 mg |
| Pantothenic acid | 0.04 mg |
| Vitamin B-6 | 0.05 mg |
| Folate, total | 2.0 ug |
| Folic acid | 0.00 ug |
| Folate, food | 2.0 ug |
| Folate, DFE | 2.0 ug |
| Choline, total | 4.0 mg |
| Vitamin B-12 | 0.00 ug |
| Vitamin B-12, added | 0.00 ug |
| Vitamin A, RAE | 2.0 ug |
| Retinol | 0.00 ug |
| Carotene, beta | 22.0 ug |
| Carotene, alpha | 0.00 ug |
| Cryptoxanthin, beta | 0.00 ug |
| Vitamin A, IU | 36.0 iu |
| Lycopene | 0.00 ug |
| Lutein + zeaxanthin | 53.0 ug |
| Vitamin E (alpha-tocopherol) | 1.4 mg |
| Vitamin E, added | 0.00 mg |
| Tocopherol, beta | 0.01 mg |
| Tocopherol, gamma | 0.46 mg |
| Tocopherol, delta | 0.03 mg |
| Tocotrienol, alpha | 0.00 mg |
| Tocotrienol, beta | 0.00 mg |
| Tocotrienol, gamma | 0.19 mg |
| Tocotrienol, delta | 0.00 mg |
| Vitamin D (D2 + D3), International Units | 0.00 iu |
| Vitamin D (D2 + D3) | 0.00 ug |
| Vitamin K (phylloquinone) | 19.9 ug |
| Vitamin K (Dihydrophylloquinone) | 0.00 ug |
| Vitamin K (Menaquinone-4) | 0.00 ug |
| Alcohol, ethyl | 0.00 g |
| Caffeine | 0.00 mg |
| Theobromine | 0.00 mg |
Fat & fatty acid profile (per 100g)
| Fatty acids, total saturated | 0.03 g |
| SFA 4:0 | 0.00 g |
| SFA 6:0 | 0.00 g |
| SFA 8:0 | 0.00 g |
| SFA 10:0 | 0.00 g |
| SFA 12:0 | 0.00 g |
| SFA 14:0 | 0.00 g |
| SFA 16:0 | 0.02 g |
| SFA 18:0 | 0.01 g |
| Fatty acids, total monounsaturated | 0.06 g |
| MUFA 16:1 | 0.00 g |
| MUFA 18:1 | 0.06 g |
| MUFA 20:1 | 0.00 g |
| MUFA 22:1 | 0.00 g |
| Fatty acids, total polyunsaturated | 0.19 g |
| PUFA 18:2 | 0.11 g |
| PUFA 18:3 | 0.07 g |
| PUFA 18:4 | 0.00 g |
| PUFA 20:4 | 0.00 g |
| PUFA 20:5 n-3 (EPA) | 0.00 g |
| PUFA 22:5 n-3 (DPA) | 0.00 g |
| PUFA 22:6 n-3 (DHA) | 0.00 g |
| Fatty acids, total trans | 0.00 g |
| Cholesterol | 0.00 mg |
Amino acid profile (per 100g)
Estimated from Blueberries, raw — USDA does not publish this profile for Blueberries.
| Tryptophan | 0.00 g |
| Threonine | 0.02 g |
| Isoleucine | 0.02 g |
| Leucine | 0.04 g |
| Lysine | 0.01 g |
| Methionine | 0.01 g |
| Cystine | 0.01 g |
| Phenylalanine | 0.03 g |
| Tyrosine | 0.01 g |
| Valine | 0.03 g |
| Arginine | 0.04 g |
| Histidine | 0.01 g |
| Alanine | 0.03 g |
| Aspartic acid | 0.06 g |
| Glutamic acid | 0.09 g |
| Glycine | 0.03 g |
| Proline | 0.03 g |
| Serine | 0.02 g |
FAQ
How do canned blueberries differ from fresh or frozen?
Canned blueberries are cooked during processing, making them softer and sweeter due to the syrup. They lack the firm, fresh 'pop' of raw berries but are pre-prepared and shelf-stable. Frozen berries are typically IQF (individually quick frozen) and retain a texture closer to fresh when thawed.
Can I use the syrup from the can?
Yes, the light syrup is edible and can be used to sweeten beverages, yogurt, or as a glaze for meats. However, it is primarily sugar water, so using it adds extra calories and sugar to your dish.
Are canned blueberries nutritious?
They retain some beneficial nutrients like fiber and antioxidants, but the canning process can reduce heat-sensitive vitamins like vitamin C. The main nutritional consideration is the added sugar from the syrup, which differentiates them from unsweetened frozen or fresh berries.
Nutrient density (calculated · NRF9.3)
Nutrient Rich Foods index: beneficial nutrients (protein, fiber, vitamins, minerals) minus saturated fat, added sugar & sodium, per 100 kcal.
NRF9.3 index — Fulgoni, Keast & Drewnowski, 2009. Computed from USDA nutrients.
Weight-loss friendliness (composite index)
Energy density 0.88 kcal/g · 5% calories from protein · 2.6 g fiber · 17.4 g sugar per 100 g.
Composite of energy density (Rolls et al., 1999), protein & fiber satiety, minus sugar. A calculated heuristic — ranks satiety-per-calorie, not a clinical measure.
Dietary load (calculated from USDA values)
Potential renal acid load. Positive = acid-forming, negative = alkaline-forming.
Sodium-to-potassium ratio: 0.06 (lower is better — aim for ≤ 1)
Sodium:potassium per WHO potassium guidance. Computed from USDA nutrients.