

Formulated bar, MARS SNACKFOOD US, SNICKERS MARATHON Energy Bar, all flavors
Whole food · Snacks

Photo: Wikipedia
The Snickers Marathon Energy Bar is a dense, chewy, nougat-and-caramel-laced bar coated in milk chocolate, engineered for sustained energy. It delivers a substantial 22g of protein per 100g, making it a favorite among athletes and busy professionals for its satisfying, candy-bar-like taste that belies its functional nutrition. The texture is a classic mix of soft nougat, sticky caramel, and crunchy peanuts.
Calorie split: 23% protein · 52% carbs · 25% fat
↓ Full nutrition💚 Why it's loved
People love it because it successfully bridges the gap between a legitimate performance snack and an indulgent treat, offering the nostalgic, craveable flavor profile of a Snickers bar with a serious protein punch. Its versatility makes it a staple in gym bags, desk drawers, and hiking packs.
⚠️ Watch-outs & how to enjoy it better
With nearly 29g of sugar per 100g, it can cause a rapid blood-sugar spike, making it a poor choice for those managing diabetes or seeking low-glycemic snacks. It's also a common allergen (contains peanuts, milk, soy) and is calorie-dense. To counteract the sugar spike, pair it with a source of healthy fat or fiber (like an apple) and practice strict portion control by enjoying half a bar at a time.
Key benefits
- High protein content supports muscle maintenance and satiety.
- Provides quick and sustained energy from a blend of carbs and fats.
- Convenient, portable format for on-the-go nutrition.
- Contains dietary fiber for digestive health.
- A familiar, palatable alternative to chalky protein supplements.
🍽️ Popular dishes
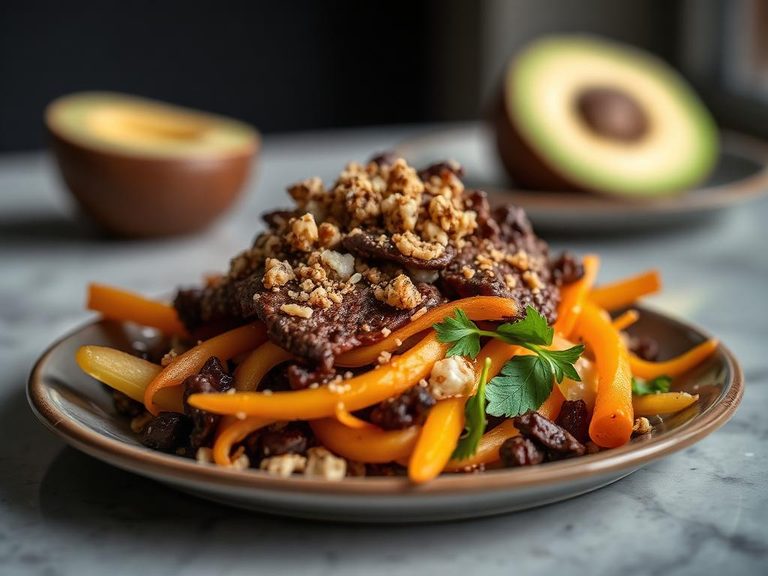
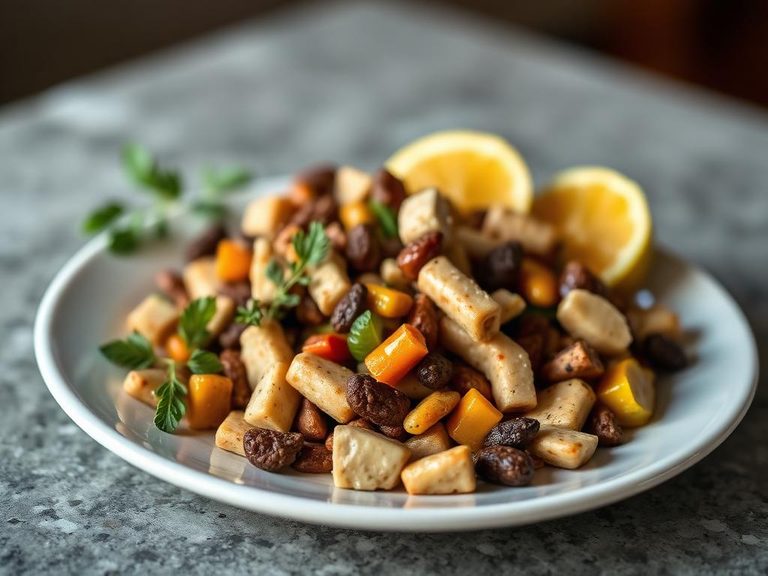


🌍 Where it's eaten
💡 Did you know?
The 'Marathon' bar name was used in the UK for decades before it was rebranded as 'Snickers' in 1990, a change so unpopular it sparked a public campaign to bring the original name back.
Full nutrition (USDA data · scales with serving)
| Water | 14.0 g |
| Energy | 386 kcal |
| Energy | 1615 kj |
| Protein | 21.9 g |
| Total lipid (fat) | 10.8 g |
| Ash | 3.0 g |
| Carbohydrate, by difference | 50.3 g |
| Fiber, total dietary | 6.7 g |
| Total Sugars | 28.7 g |
| Sucrose | 14.3 g |
| Glucose | 8.6 g |
| Fructose | 0.48 g |
| Lactose | 0.00 g |
| Maltose | 5.3 g |
| Galactose | 0.00 g |
| Calcium, Ca | 754 mg |
| Iron, Fe | 16.3 mg |
| Magnesium, Mg | 317 mg |
| Phosphorus, P | 455 mg |
| Potassium, K | 351 mg |
| Sodium, Na | 383 mg |
| Zinc, Zn | 11.9 mg |
| Copper, Cu | 0.45 mg |
| Manganese, Mn | 1.1 mg |
| Selenium, Se | 4.5 ug |
| Fluoride, F | 0.00 ug |
| Vitamin C, total ascorbic acid | 490 mg |
| Thiamin | 2.9 mg |
| Riboflavin | 3.3 mg |
| Niacin | 45.2 mg |
| Pantothenic acid | 22.6 mg |
| Vitamin B-6 | 4.5 mg |
| Folate, total | 816 ug |
| Folic acid | 739 ug |
| Folate, food | 77.0 ug |
| Folate, DFE | 1334 ug |
| Choline, total | 18.0 mg |
| Vitamin B-12 | 10.9 ug |
| Vitamin B-12, added | 10.7 ug |
| Vitamin A, RAE | 62.0 ug |
| Retinol | 62.0 ug |
| Carotene, beta | 0.00 ug |
| Carotene, alpha | 0.00 ug |
| Cryptoxanthin, beta | 0.00 ug |
| Vitamin A, IU | 209 iu |
| Lycopene | 0.00 ug |
| Lutein + zeaxanthin | 0.00 ug |
| Vitamin E (alpha-tocopherol) | 27.5 mg |
| Vitamin E, added | 26.2 mg |
| Vitamin D (D2 + D3), International Units | 181 iu |
| Vitamin D (D2 + D3) | 4.5 ug |
| Vitamin K (phylloquinone) | 1.8 ug |
| Vitamin K (Dihydrophylloquinone) | 0.00 ug |
| Alcohol, ethyl | 0.00 g |
| Caffeine | 6.0 mg |
| Theobromine | 57.0 mg |
Fat & fatty acid profile (per 100g)
| Fatty acids, total saturated | 4.8 g |
| SFA 4:0 | 0.14 g |
| SFA 6:0 | 0.05 g |
| SFA 8:0 | 0.03 g |
| SFA 10:0 | 0.06 g |
| SFA 12:0 | 0.06 g |
| SFA 13:0 | 0.00 g |
| SFA 14:0 | 0.21 g |
| SFA 15:0 | 0.02 g |
| SFA 16:0 | 2.3 g |
| SFA 17:0 | 0.02 g |
| SFA 18:0 | 1.8 g |
| SFA 20:0 | 0.05 g |
| SFA 22:0 | 0.01 g |
| SFA 24:0 | 0.00 g |
| Fatty acids, total monounsaturated | 3.9 g |
| MUFA 14:1 | 0.02 g |
| MUFA 15:1 | 0.00 g |
| MUFA 16:1 | 0.05 g |
| MUFA 17:1 | 0.01 g |
| MUFA 18:1 | 3.8 g |
| MUFA 20:1 | 0.05 g |
| MUFA 22:1 | 0.00 g |
| MUFA 24:1 c | 0.00 g |
| Fatty acids, total polyunsaturated | 1.9 g |
| PUFA 18:2 | 1.9 g |
| PUFA 18:3 | 0.03 g |
| PUFA 18:4 | 0.00 g |
| PUFA 20:2 n-6 c,c | 0.00 g |
| PUFA 20:3 | 0.00 g |
| PUFA 20:4 | 0.00 g |
| PUFA 20:5 n-3 (EPA) | 0.00 g |
| PUFA 21:5 | 0.00 g |
| PUFA 22:4 | 0.00 g |
| PUFA 22:5 n-3 (DPA) | 0.00 g |
| PUFA 22:6 n-3 (DHA) | 0.00 g |
| Fatty acids, total trans | 0.15 g |
| Cholesterol | 4.0 mg |
Amino acid profile (per 100g)
| Tryptophan | 0.22 g |
| Threonine | 0.68 g |
| Isoleucine | 0.83 g |
| Leucine | 1.4 g |
| Lysine | 0.97 g |
| Methionine | 0.27 g |
| Cystine | 0.24 g |
| Phenylalanine | 0.98 g |
| Tyrosine | 0.74 g |
| Valine | 0.90 g |
| Arginine | 1.7 g |
| Histidine | 0.48 g |
| Alanine | 0.76 g |
| Aspartic acid | 2.2 g |
| Glutamic acid | 3.8 g |
| Glycine | 0.88 g |
| Proline | 1.1 g |
| Serine | 0.97 g |
| Hydroxyproline | 0.00 g |
FAQ
Is the Snickers Marathon bar the same as a regular Snickers?
No. While they share a name and some ingredients, the Marathon/Performance bar is specifically formulated with significantly more protein (about 22g vs. 4g per 100g) and less sugar than the classic candy bar, targeting athletes and health-conscious consumers.
Can I eat this bar if I'm trying to lose weight?
It can fit in a calorie-controlled diet due to its high protein, which promotes fullness. However, its high sugar and calorie density mean it should be consumed mindfully as an occasional treat or strategic energy boost, not a daily snack.
What makes it an 'energy bar'?
Its macronutrient profile is designed for fuel: a mix of fast-acting carbs (from sugar and maltodextrin) for immediate energy and slower-digesting carbs and fats for sustained release, alongside protein for muscle support.
Nutrient density (calculated · NRF9.3)
Nutrient Rich Foods index: beneficial nutrients (protein, fiber, vitamins, minerals) minus saturated fat, added sugar & sodium, per 100 kcal.
NRF9.3 index — Fulgoni, Keast & Drewnowski, 2009. Computed from USDA nutrients.
Weight-loss friendliness (composite index)
Energy density 3.86 kcal/g · 23% calories from protein · 6.7 g fiber · 28.7 g sugar per 100 g.
Composite of energy density (Rolls et al., 1999), protein & fiber satiety, minus sugar. A calculated heuristic — ranks satiety-per-calorie, not a clinical measure.
Dietary load (calculated from USDA values)
Potential renal acid load. Positive = acid-forming, negative = alkaline-forming.
Sodium-to-potassium ratio: 1.09 (lower is better — aim for ≤ 1)
Sodium:potassium per WHO potassium guidance. Computed from USDA nutrients.