

Carrots, frozen, cooked, boiled, drained, without salt
Whole food · Vegetables and Vegetable Products

Photo: Wikipedia
These are carrots that have been flash-frozen at peak ripeness, then boiled until tender-crisp and drained, resulting in a vibrant, sweet, and slightly earthy bite with a soft yet firm texture. Nutritionally, they are a low-calorie powerhouse, delivering a significant dose of beta-carotene (vitamin A precursor) and a respectable amount of dietary fiber in each serving.
Calorie split: 6% protein · 79% carbs · 16% fat
↓ Full nutrition💚 Why it's loved
People love them for their natural, concentrated sweetness that intensifies with cooking, and their incredible versatility as a quick side dish, soup base, or ingredient in casseroles. They are a staple in home cooking for their reliability, bright color, and comforting, familiar flavor.
⚠️ Watch-outs & how to enjoy it better
The boiling process can leach some water-soluble vitamins (like vitamin C) and may result in a softer, less crisp texture than fresh carrots. For those monitoring blood sugar, the 4.08g of naturally occurring sugar per 100g can contribute to spikes if consumed in large portions alone. To counteract this, pair them with a source of protein or healthy fat (like butter, nuts, or lean meat) to slow sugar absorption and enhance nutrient uptake.
Key benefits
- Excellent source of beta-carotene, which the body converts to vitamin A.
- Good source of dietary fiber for digestive health.
- Very low in calories and fat, supporting weight management.
- Provides antioxidants like lutein and lycopene.
- Convenient year-round source of vegetable nutrients.
🍽️ Popular dishes
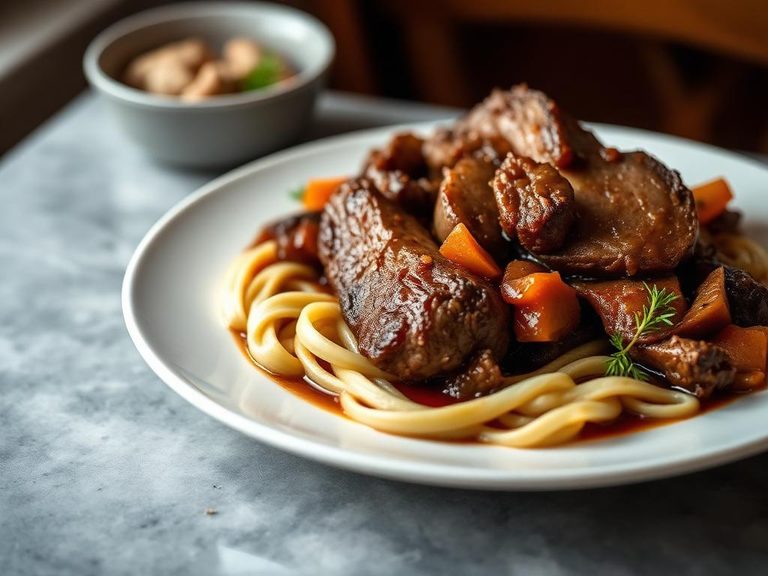
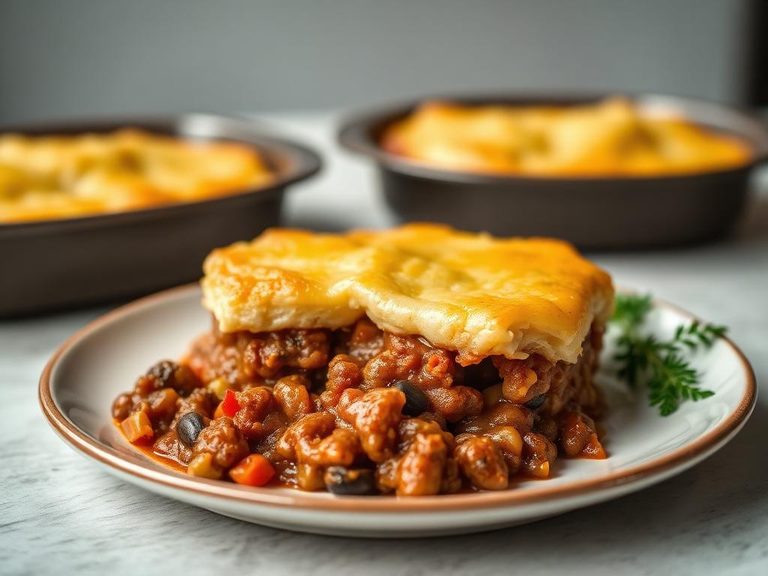
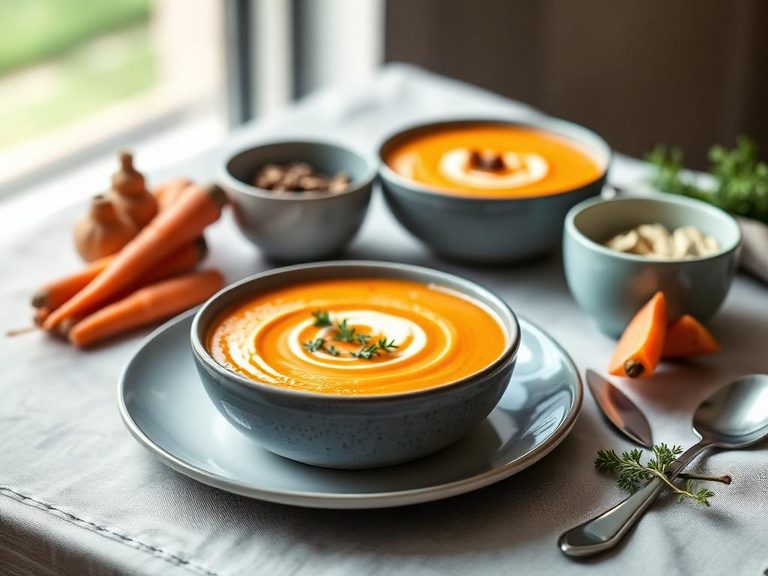

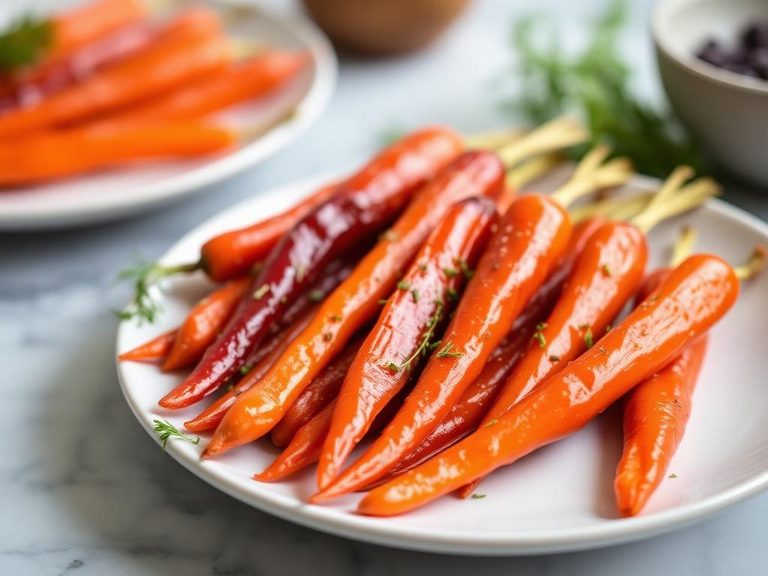
🌍 Where it's eaten
💡 Did you know?
The beta-carotene in carrots is fat-soluble, meaning your body absorbs significantly more of this vital nutrient when you eat them with a little dietary fat.
Full nutrition (USDA data · scales with serving)
| Water | 90.3 g |
| Energy | 37.0 kcal |
| Energy | 155 kj |
| Protein | 0.58 g |
| Total lipid (fat) | 0.68 g |
| Ash | 0.69 g |
| Carbohydrate, by difference | 7.7 g |
| Fiber, total dietary | 3.3 g |
| Total Sugars | 4.1 g |
| Sucrose | 3.4 g |
| Glucose | 0.36 g |
| Fructose | 0.28 g |
| Lactose | 0.00 g |
| Maltose | 0.00 g |
| Galactose | 0.00 g |
| Starch | 0.31 g |
| Calcium, Ca | 35.0 mg |
| Iron, Fe | 0.53 mg |
| Magnesium, Mg | 11.0 mg |
| Phosphorus, P | 31.0 mg |
| Potassium, K | 192 mg |
| Sodium, Na | 59.0 mg |
| Zinc, Zn | 0.35 mg |
| Copper, Cu | 0.08 mg |
| Manganese, Mn | 0.17 mg |
| Selenium, Se | 0.60 ug |
| Vitamin C, total ascorbic acid | 2.3 mg |
| Thiamin | 0.03 mg |
| Riboflavin | 0.04 mg |
| Niacin | 0.42 mg |
| Pantothenic acid | 0.17 mg |
| Vitamin B-6 | 0.08 mg |
| Folate, total | 11.0 ug |
| Folic acid | 0.00 ug |
| Folate, food | 11.0 ug |
| Folate, DFE | 11.0 ug |
| Choline, total | 8.6 mg |
| Betaine | 0.10 mg |
| Vitamin B-12 | 0.00 ug |
| Vitamin B-12, added | 0.00 ug |
| Vitamin A, RAE | 846 ug |
| Retinol | 0.00 ug |
| Carotene, beta | 8199 ug |
| Carotene, alpha | 3716 ug |
| Cryptoxanthin, beta | 199 ug |
| Vitamin A, IU | 16928 iu |
| Lycopene | 0.00 ug |
| Lutein + zeaxanthin | 676 ug |
| Vitamin E (alpha-tocopherol) | 1.0 mg |
| Vitamin E, added | 0.00 mg |
| Vitamin D (D2 + D3), International Units | 0.00 iu |
| Vitamin D (D2 + D3) | 0.00 ug |
| Vitamin K (phylloquinone) | 13.6 ug |
| Vitamin K (Dihydrophylloquinone) | 0.00 ug |
| Alcohol, ethyl | 0.00 g |
| Caffeine | 0.00 mg |
| Theobromine | 0.00 mg |
Fat & fatty acid profile (per 100g)
| Fatty acids, total saturated | 0.12 g |
| SFA 4:0 | 0.00 g |
| SFA 6:0 | 0.00 g |
| SFA 8:0 | 0.00 g |
| SFA 10:0 | 0.00 g |
| SFA 12:0 | 0.01 g |
| SFA 14:0 | 0.01 g |
| SFA 15:0 | 0.00 g |
| SFA 16:0 | 0.10 g |
| SFA 18:0 | 0.01 g |
| SFA 20:0 | 0.00 g |
| SFA 22:0 | 0.00 g |
| SFA 24:0 | 0.00 g |
| Fatty acids, total monounsaturated | 0.03 g |
| MUFA 14:1 | 0.00 g |
| MUFA 16:1 | 0.01 g |
| MUFA 18:1 | 0.03 g |
| MUFA 20:1 | 0.00 g |
| MUFA 22:1 | 0.00 g |
| Fatty acids, total polyunsaturated | 0.33 g |
| PUFA 18:2 | 0.29 g |
| PUFA 18:3 | 0.04 g |
| PUFA 18:4 | 0.00 g |
| PUFA 20:4 | 0.00 g |
| PUFA 20:5 n-3 (EPA) | 0.00 g |
| PUFA 22:5 n-3 (DPA) | 0.00 g |
| PUFA 22:6 n-3 (DHA) | 0.00 g |
| Fatty acids, total trans | 0.00 g |
| Cholesterol | 0.00 mg |
Amino acid profile (per 100g)
| Tryptophan | 0.01 g |
| Threonine | 0.12 g |
| Isoleucine | 0.05 g |
| Leucine | 0.06 g |
| Lysine | 0.06 g |
| Methionine | 0.01 g |
| Cystine | 0.05 g |
| Phenylalanine | 0.04 g |
| Tyrosine | 0.03 g |
| Valine | 0.04 g |
| Arginine | 0.06 g |
| Histidine | 0.03 g |
| Alanine | 0.07 g |
| Aspartic acid | 0.12 g |
| Glutamic acid | 0.23 g |
| Glycine | 0.03 g |
| Proline | 0.03 g |
| Serine | 0.03 g |
FAQ
How do frozen cooked carrots compare nutritionally to fresh boiled carrots?
They are very similar. Flash-freezing preserves nutrients well. The main difference is that frozen carrots are pre-cooked, so they may have slightly lower levels of heat-sensitive vitamins like vitamin C compared to freshly boiled carrots, but their beta-carotene and fiber content remain robust.
Can I use these directly in recipes without thawing?
Yes, for most soups, stews, and casseroles, you can add them directly from frozen. They will release some water as they heat, which is usually accounted for in the recipe's liquid content.
Why are they sometimes a bit mushy?
Texture can vary based on the carrot variety, the size of the pieces, and the exact blanching/freezing process. To retain more firmness, look for brands labeled 'crinkle-cut' or 'diced,' and avoid overcooking them when reheating.
Nutrient density (calculated · NRF9.3)
Nutrient Rich Foods index: beneficial nutrients (protein, fiber, vitamins, minerals) minus saturated fat, added sugar & sodium, per 100 kcal.
NRF9.3 index — Fulgoni, Keast & Drewnowski, 2009. Computed from USDA nutrients.
Weight-loss friendliness (composite index)
Energy density 0.37 kcal/g · 6% calories from protein · 3.3 g fiber · 4.1 g sugar per 100 g.
Composite of energy density (Rolls et al., 1999), protein & fiber satiety, minus sugar. A calculated heuristic — ranks satiety-per-calorie, not a clinical measure.
Dietary load (calculated from USDA values)
Potential renal acid load. Positive = acid-forming, negative = alkaline-forming.
Sodium-to-potassium ratio: 0.31 (lower is better — aim for ≤ 1)
Sodium:potassium per WHO potassium guidance. Computed from USDA nutrients.