

Salad dressing, ranch dressing, fat-free
Whole food · Fats and Oils

Photo: Wikipedia
This is the guilt-free cousin of classic ranch, a creamy, tangy, and herby dressing with a smooth, pourable texture. Its nutrition profile is defined by its low calorie count and near-total absence of fat, making it a light, calorie-conscious choice. The trade-off is a higher carbohydrate content, primarily from added sugars and starches used to mimic the mouthfeel of its full-fat counterpart.
Calorie split: 1% protein · 85% carbs · 14% fat
↓ Full nutrition💚 Why it's loved
People love it for delivering the familiar, savory, and herb-forward ranch flavor they crave, but without the significant calorie and fat load of traditional versions. It's a versatile staple that can instantly make raw vegetables, baked potatoes, or grain bowls more appealing and satisfying.
⚠️ Watch-outs & how to enjoy it better
The main downside is the relatively high carbohydrate and added sugar content (over 5g per 100g) for a condiment, which can contribute to blood-sugar spikes if used generously. It is also typically high in sodium and often contains common allergens like soy and egg derivatives. To counteract this, practice portion control (1-2 tablespoons), pair it with a source of protein or healthy fat (like grilled chicken or avocado) to slow sugar absorption, and consider it a flavor accent rather than a main sauce.
Key benefits
- Very low in calories per serving
- Virtually fat-free
- Provides a creamy, flavorful coating for salads
- Convenient, shelf-stable, and ready to use
- Can help increase vegetable intake for those who find plain salads bland
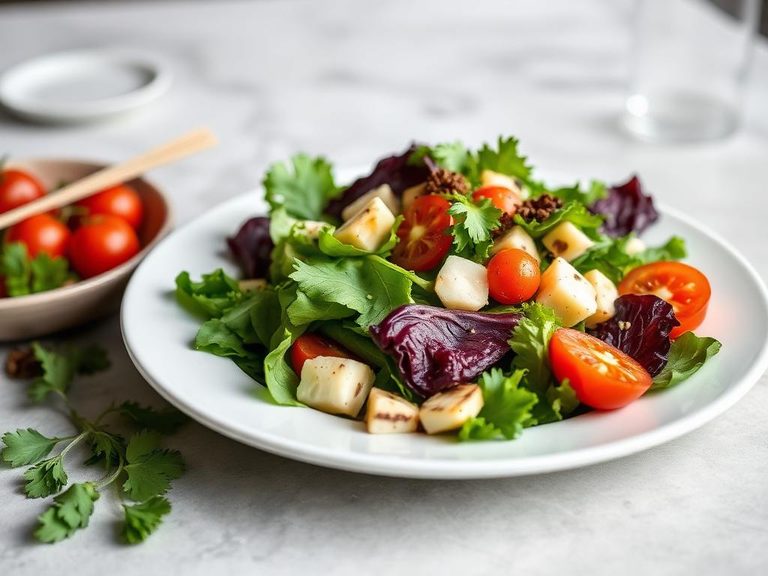
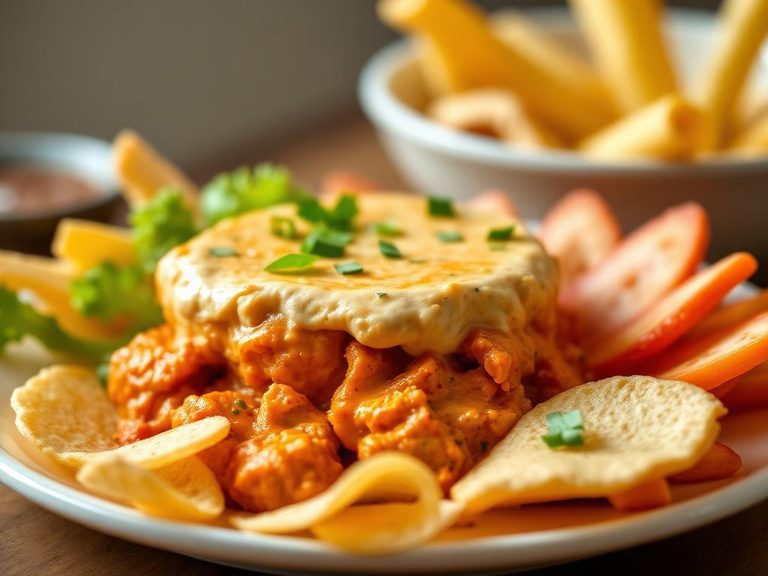
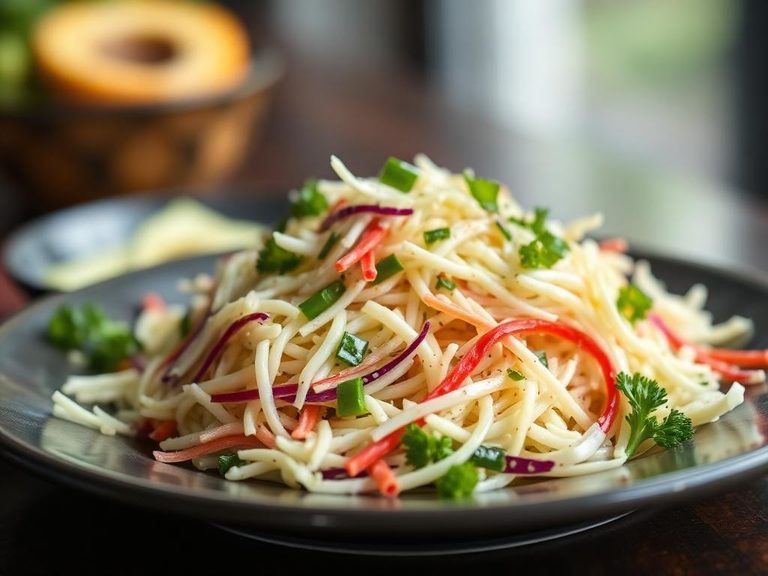
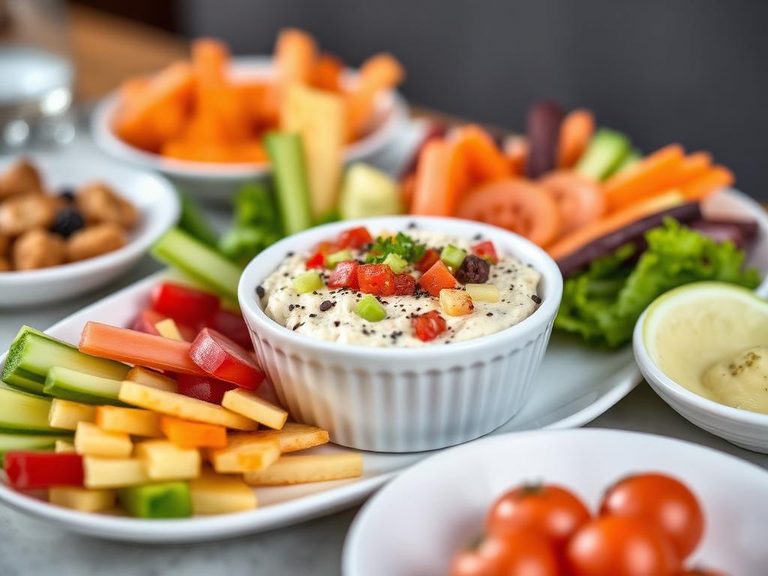
🍽️ Popular dishes

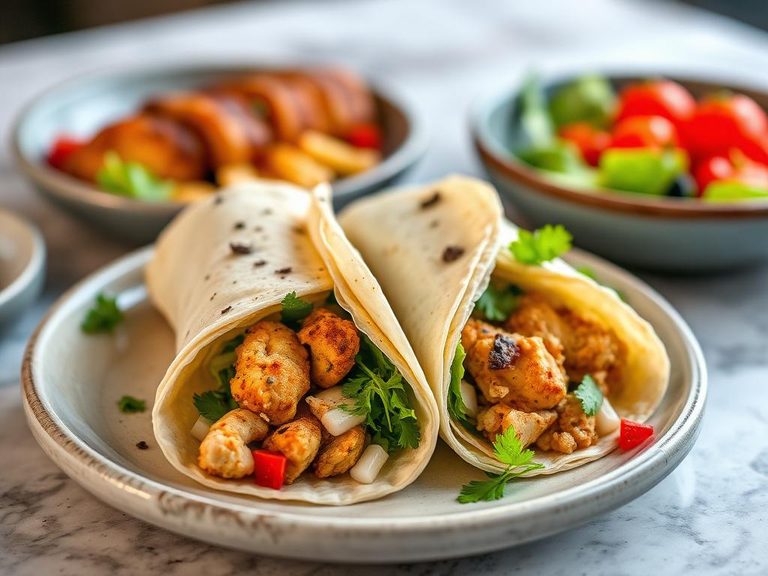
🌍 Where it's eaten
💡 Did you know?
The original Ranch dressing was invented in 1954 by a plumber and his wife who ran a dude ranch in Alaska, California, and it was first sold as 'Ranch Style' dressing at their Hidden Valley Ranch.
Full nutrition (USDA data · scales with serving)
| Water | 68.3 g |
| Energy | 119 kcal |
| Energy | 497 kj |
| Protein | 0.25 g |
| Total lipid (fat) | 1.9 g |
| Ash | 3.0 g |
| Carbohydrate, by difference | 26.5 g |
| Fiber, total dietary | 0.10 g |
| Total Sugars | 5.3 g |
| Sucrose | 1.6 g |
| Glucose | 1.9 g |
| Fructose | 0.42 g |
| Lactose | 0.07 g |
| Maltose | 1.4 g |
| Galactose | 0.00 g |
| Starch | 5.0 g |
| Calcium, Ca | 50.0 mg |
| Iron, Fe | 1.1 mg |
| Magnesium, Mg | 8.0 mg |
| Phosphorus, P | 113 mg |
| Potassium, K | 111 mg |
| Sodium, Na | 897 mg |
| Zinc, Zn | 0.40 mg |
| Copper, Cu | 0.20 mg |
| Manganese, Mn | 0.11 mg |
| Selenium, Se | 0.80 ug |
| Vitamin C, total ascorbic acid | 0.00 mg |
| Thiamin | 0.03 mg |
| Riboflavin | 0.03 mg |
| Niacin | 0.01 mg |
| Pantothenic acid | 0.77 mg |
| Vitamin B-6 | 0.02 mg |
| Folate, total | 6.0 ug |
| Folic acid | 0.00 ug |
| Folate, food | 6.0 ug |
| Folate, DFE | 6.0 ug |
| Vitamin B-12 | 0.00 ug |
| Vitamin A, RAE | 1.0 ug |
| Retinol | 1.0 ug |
| Carotene, beta | 0.00 ug |
| Carotene, alpha | 0.00 ug |
| Cryptoxanthin, beta | 0.00 ug |
| Vitamin A, IU | 3.0 iu |
| Lycopene | 0.00 ug |
| Lutein + zeaxanthin | 4.0 ug |
| Vitamin E (alpha-tocopherol) | 0.18 mg |
| Vitamin K (phylloquinone) | 2.3 ug |
| Vitamin K (Dihydrophylloquinone) | 0.00 ug |
| Alcohol, ethyl | 0.00 g |
| Caffeine | 0.00 mg |
| Theobromine | 0.00 mg |
Fat & fatty acid profile (per 100g)
| Fatty acids, total saturated | 0.45 g |
| SFA 4:0 | 0.00 g |
| SFA 6:0 | 0.00 g |
| SFA 8:0 | 0.00 g |
| SFA 10:0 | 0.00 g |
| SFA 12:0 | 0.00 g |
| SFA 14:0 | 0.04 g |
| SFA 16:0 | 0.24 g |
| SFA 17:0 | 0.01 g |
| SFA 18:0 | 0.15 g |
| SFA 20:0 | 0.01 g |
| SFA 22:0 | 0.00 g |
| SFA 24:0 | 0.00 g |
| Fatty acids, total monounsaturated | 0.39 g |
| MUFA 16:1 | 0.01 g |
| MUFA 16:1 c | 0.01 g |
| MUFA 18:1 | 0.37 g |
| MUFA 18:1 c | 0.36 g |
| MUFA 20:1 | 0.01 g |
| MUFA 22:1 | 0.00 g |
| MUFA 24:1 c | 0.00 g |
| Fatty acids, total polyunsaturated | 0.70 g |
| PUFA 18:2 | 0.62 g |
| PUFA 18:2 n-6 c,c | 0.61 g |
| PUFA 18:2 i | 0.01 g |
| PUFA 18:3 | 0.08 g |
| PUFA 18:3 n-3 c,c,c (ALA) | 0.08 g |
| PUFA 18:4 | 0.00 g |
| PUFA 20:4 | 0.00 g |
| PUFA 20:5 n-3 (EPA) | 0.00 g |
| PUFA 22:5 n-3 (DPA) | 0.00 g |
| PUFA 22:6 n-3 (DHA) | 0.00 g |
| TFA 18:1 t | 0.01 g |
| Cholesterol | 7.0 mg |
Amino acid profile (per 100g)
Estimated from Salad dressing, sesame seed dressing, regular — USDA does not publish this profile for Salad dressing.
| Tryptophan | 0.05 g |
| Threonine | 0.05 g |
| Isoleucine | 0.05 g |
| Leucine | 0.08 g |
| Lysine | 0.14 g |
| Methionine | 0.03 g |
| Cystine | 0.00 g |
| Phenylalanine | 0.09 g |
| Tyrosine | 0.10 g |
| Valine | 0.07 g |
| Arginine | 0.40 g |
| Histidine | 0.03 g |
| Alanine | 0.00 g |
| Aspartic acid | 0.00 g |
| Glutamic acid | 0.46 g |
| Glycine | 0.00 g |
| Proline | 0.00 g |
| Serine | 0.00 g |
FAQ
Is fat-free ranch healthier than regular ranch?
It's a trade-off. Fat-free ranch is significantly lower in calories and fat, which can be beneficial for weight management. However, it often contains more added sugar, carbohydrates, and sodium to compensate for the flavor and texture lost from the fat. Regular ranch in moderation may be more satiating due to its fat content.
Why does fat-free ranch taste different?
Fat carries flavor and provides a rich, creamy mouthfeel. When fat is removed, manufacturers add thickeners (like starches or gums), sweeteners, and extra flavorings to replicate that experience, resulting in a slightly different, often sweeter or more artificial taste.
Can I use fat-free ranch for cooking or baking?
It's not ideal for high-heat cooking or baking as it lacks the fat needed for proper browning and moisture. It works best as a cold dressing, dip, or drizzle. You can mix it into cold pasta salads or use it as a base for a lighter creamy sauce if you're mindful of its higher sugar content.
Nutrient density (calculated · NRF9.3)
Nutrient Rich Foods index: beneficial nutrients (protein, fiber, vitamins, minerals) minus saturated fat, added sugar & sodium, per 100 kcal.
NRF9.3 index — Fulgoni, Keast & Drewnowski, 2009. Computed from USDA nutrients.
Weight-loss friendliness (composite index)
Energy density 1.19 kcal/g · 1% calories from protein · 0.1 g fiber · 5.3 g sugar per 100 g.
Composite of energy density (Rolls et al., 1999), protein & fiber satiety, minus sugar. A calculated heuristic — ranks satiety-per-calorie, not a clinical measure.
Dietary load (calculated from USDA values)
Potential renal acid load. Positive = acid-forming, negative = alkaline-forming.
Sodium-to-potassium ratio: 8.08 (lower is better — aim for ≤ 1)
Sodium:potassium per WHO potassium guidance. Computed from USDA nutrients.