

Formulated bar, MARS SNACKFOOD US, SNICKERS MARATHON Protein Performance Bar, Caramel Nut Rush
Whole food · Snacks

Photo: Wikipedia
This is a dense, chewy protein bar designed for athletic performance, featuring a caramel-nut flavor profile. Its texture is a satisfying mix of crunchy nuts and nougat-like base, coated in a layer of milk chocolate. Nutritionally, it delivers a significant protein punch (25g per 100g) alongside a high carbohydrate content for energy.
Calorie split: 24% protein · 49% carbs · 27% fat
↓ Full nutrition💚 Why it's loved
People love it for its indulgent, candy-bar-like taste that masks its functional purpose, making it a treat rather than a chore. It's a go-to for athletes and busy individuals needing a reliable, calorie-dense energy boost that feels familiar and satisfying.
⚠️ Watch-outs & how to enjoy it better
The high sugar content (28.75g per 100g) can cause a rapid blood-sugar spike followed by a crash, making it a poor choice for sustained energy or for those managing blood sugar. To counteract this, pair it with a source of healthy fat or extra protein (like a handful of almonds) and consume it immediately before or during intense exercise when the sugars are utilized as fuel.
Key benefits
- High protein content supports muscle repair and satiety.
- Provides a quick and substantial energy source from carbohydrates.
- Contains dietary fiber (12.5g per 100g) for digestive health.
- Convenient, portable format for on-the-go nutrition.
- Specifically formulated for athletic performance and recovery.
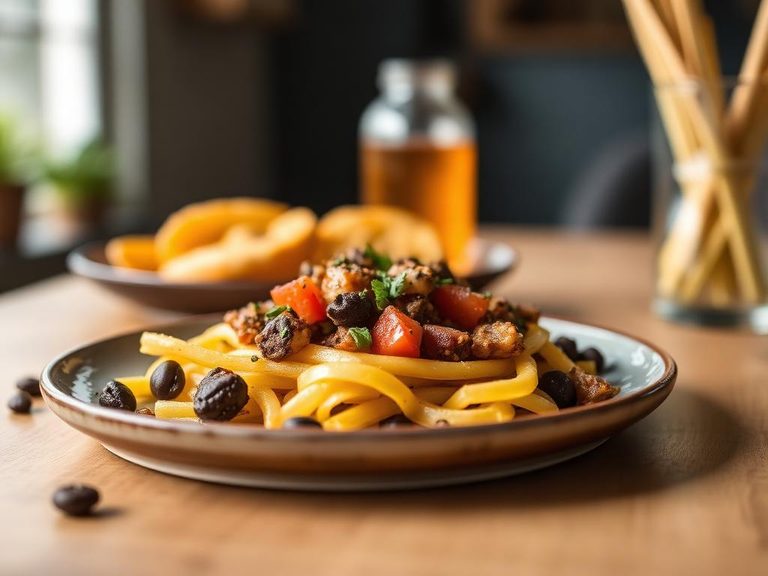
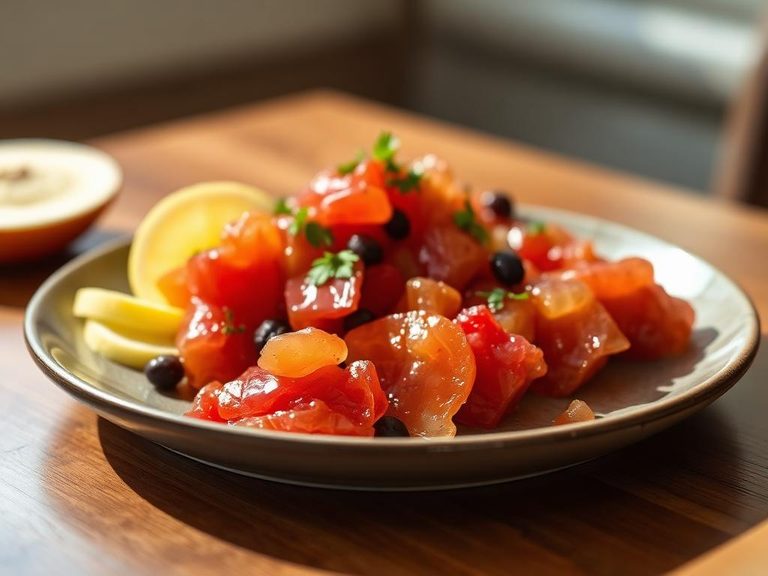
🍽️ Popular dishes


🌍 Where it's eaten
💡 Did you know?
The 'Marathon' in its name is a direct nod to its original marketing as a fuel for endurance athletes, a legacy from the Mars company's early 20th-century focus on providing portable energy for active people.
Full nutrition (USDA data · scales with serving)
| Water | 9.0 g |
| Energy | 415 kcal |
| Energy | 1734 kj |
| Protein | 25.0 g |
| Total lipid (fat) | 12.5 g |
| Ash | 3.0 g |
| Carbohydrate, by difference | 50.5 g |
| Fiber, total dietary | 12.5 g |
| Total Sugars | 28.8 g |
| Calcium, Ca | 625 mg |
| Iron, Fe | 10.1 mg |
| Magnesium, Mg | 175 mg |
| Phosphorus, P | 375 mg |
| Potassium, K | 188 mg |
| Sodium, Na | 238 mg |
| Zinc, Zn | 6.6 mg |
| Copper, Cu | 0.98 mg |
| Manganese, Mn | 1.3 mg |
| Selenium, Se | 3.9 ug |
| Fluoride, F | 4.3 ug |
| Vitamin C, total ascorbic acid | 75.0 mg |
| Thiamin | 1.9 mg |
| Riboflavin | 2.1 mg |
| Niacin | 25.0 mg |
| Pantothenic acid | 12.5 mg |
| Vitamin B-6 | 2.5 mg |
| Folate, total | 500 ug |
| Folic acid | 500 ug |
| Folate, food | 0.00 ug |
| Folate, DFE | 850 ug |
| Choline, total | 1.7 mg |
| Betaine | 0.00 mg |
| Vitamin B-12 | 7.5 ug |
| Vitamin B-12, added | 7.4 ug |
| Vitamin A, RAE | 652 ug |
| Retinol | 651 ug |
| Carotene, beta | 10.0 ug |
| Carotene, alpha | 0.00 ug |
| Cryptoxanthin, beta | 0.00 ug |
| Vitamin A, IU | 2188 iu |
| Lycopene | 0.00 ug |
| Lutein + zeaxanthin | 0.00 ug |
| Vitamin E (alpha-tocopherol) | 16.9 mg |
| Vitamin E, added | 16.0 mg |
| Tocopherol, beta | 0.00 mg |
| Tocopherol, gamma | 0.00 mg |
| Tocopherol, delta | 0.00 mg |
| Tocotrienol, alpha | 0.00 mg |
| Tocotrienol, beta | 0.00 mg |
| Tocotrienol, gamma | 0.00 mg |
| Tocotrienol, delta | 0.00 mg |
| Vitamin D (D2 + D3), International Units | 150 iu |
| Vitamin D (D2 + D3) | 3.8 ug |
| Vitamin K (phylloquinone) | 10.4 ug |
| Vitamin K (Dihydrophylloquinone) | 0.00 ug |
| Alcohol, ethyl | 0.00 g |
| Caffeine | 3.0 mg |
| Theobromine | 28.0 mg |
Fat & fatty acid profile (per 100g)
| Fatty acids, total saturated | 6.3 g |
| SFA 4:0 | 0.07 g |
| SFA 6:0 | 0.03 g |
| SFA 8:0 | 0.02 g |
| SFA 10:0 | 0.03 g |
| SFA 12:0 | 0.03 g |
| SFA 13:0 | 0.00 g |
| SFA 14:0 | 0.12 g |
| SFA 15:0 | 0.01 g |
| SFA 16:0 | 1.6 g |
| SFA 17:0 | 0.01 g |
| SFA 18:0 | 1.0 g |
| SFA 20:0 | 0.02 g |
| SFA 22:0 | 0.00 g |
| SFA 24:0 | 0.00 g |
| Fatty acids, total monounsaturated | 2.6 g |
| MUFA 14:1 | 0.01 g |
| MUFA 15:1 | 0.00 g |
| MUFA 16:1 | 0.04 g |
| MUFA 17:1 | 0.00 g |
| MUFA 18:1 | 2.6 g |
| MUFA 20:1 | 0.02 g |
| MUFA 22:1 | 0.00 g |
| MUFA 24:1 c | 0.00 g |
| Fatty acids, total polyunsaturated | 2.9 g |
| PUFA 18:2 | 2.7 g |
| PUFA 18:3 | 0.22 g |
| PUFA 18:4 | 0.00 g |
| PUFA 20:2 n-6 c,c | 0.00 g |
| PUFA 20:3 | 0.00 g |
| PUFA 20:4 | 0.00 g |
| PUFA 20:5 n-3 (EPA) | 0.00 g |
| PUFA 22:5 n-3 (DPA) | 0.00 g |
| PUFA 22:6 n-3 (DHA) | 0.00 g |
| Fatty acids, total trans | 0.00 g |
| Cholesterol | 6.0 mg |
Amino acid profile (per 100g)
| Tryptophan | 0.31 g |
| Threonine | 0.96 g |
| Isoleucine | 1.2 g |
| Leucine | 1.9 g |
| Lysine | 1.4 g |
| Methionine | 0.34 g |
| Cystine | 0.33 g |
| Phenylalanine | 1.3 g |
| Tyrosine | 1.00 g |
| Valine | 1.2 g |
| Arginine | 2.3 g |
| Histidine | 0.67 g |
| Alanine | 1.1 g |
| Aspartic acid | 3.0 g |
| Glutamic acid | 5.2 g |
| Glycine | 1.2 g |
| Proline | 1.4 g |
| Serine | 1.4 g |
| Hydroxyproline | 0.00 g |
FAQ
Is this bar a complete meal replacement?
No. While calorie-dense and high in protein, it lacks the balanced micronutrients (vitamins, minerals, phytonutrients) and the diverse macronutrient profile of a whole-food meal. It's best used as a supplement or snack.
How does it differ from a regular Snickers bar?
It has roughly double the protein and significantly less sugar per gram than a standard Snickers, with a denser, more chewy texture designed for sustained energy release rather than a quick sugar rush.
When is the optimal time to eat it?
The best times are 30-60 minutes before a workout for pre-fueling or immediately after exercise to kickstart muscle recovery. It can also serve as a substantial snack to bridge a long gap between meals.
Nutrient density (calculated · NRF9.3)
Nutrient Rich Foods index: beneficial nutrients (protein, fiber, vitamins, minerals) minus saturated fat, added sugar & sodium, per 100 kcal.
NRF9.3 index — Fulgoni, Keast & Drewnowski, 2009. Computed from USDA nutrients.
Weight-loss friendliness (composite index)
Energy density 4.15 kcal/g · 24% calories from protein · 12.5 g fiber · 28.8 g sugar per 100 g.
Composite of energy density (Rolls et al., 1999), protein & fiber satiety, minus sugar. A calculated heuristic — ranks satiety-per-calorie, not a clinical measure.
Dietary load (calculated from USDA values)
Potential renal acid load. Positive = acid-forming, negative = alkaline-forming.
Sodium-to-potassium ratio: 1.27 (lower is better — aim for ≤ 1)
Sodium:potassium per WHO potassium guidance. Computed from USDA nutrients.