

Flour, pastry, unenriched, unbleached
Whole food · Cereal Grains and Pasta
Unenriched, unbleached pastry flour is a finely milled, soft wheat flour prized for its low protein content, which yields tender, delicate crumb structures in baked goods. Its pale, creamy color and silky texture make it ideal for creating flaky pastries and light cakes without the tough chew of bread flour. With 77.2g of carbs per 100g, it's a concentrated energy source that provides the structural foundation for countless classic desserts.
Calorie split: 10% protein · 86% carbs · 4% fat
↓ Full nutrition💚 Why it's loved
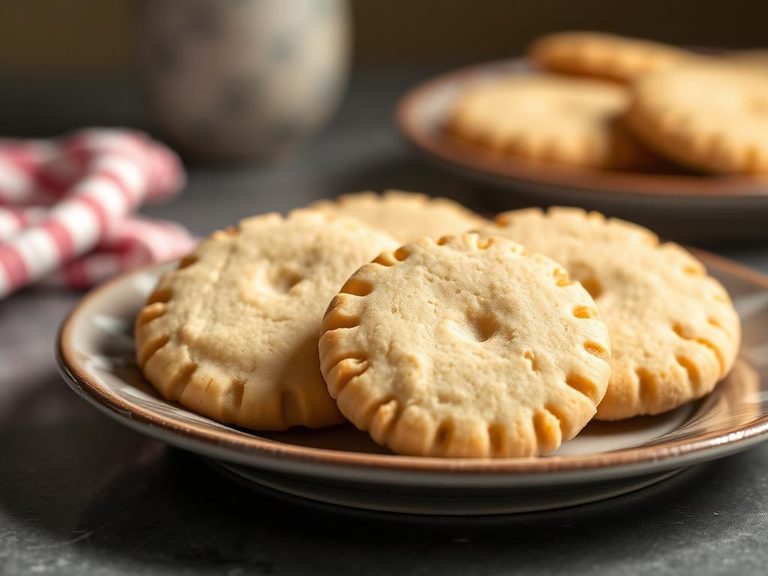
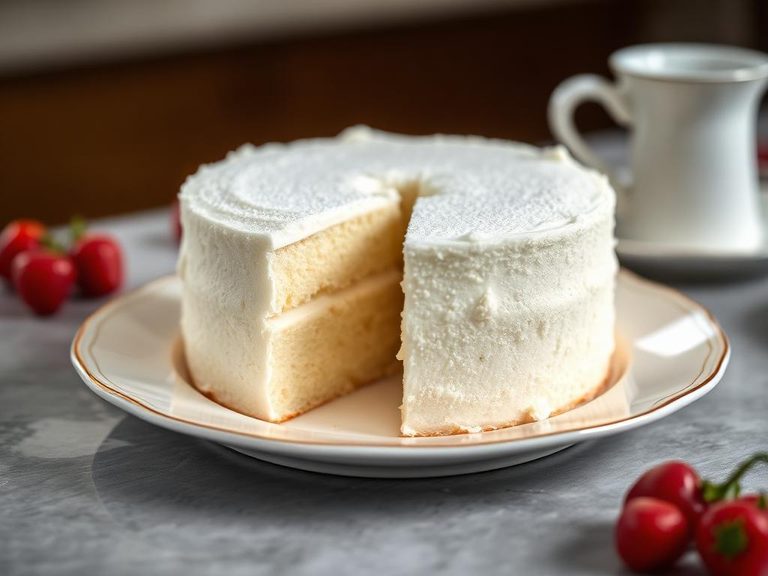
Bakers cherish it for the way it transforms into ethereal, melt-in-your-mouth pie crusts and tender shortbread, with a subtle wheat sweetness that complements rather than competes with other flavors. Its reliability in creating consistent, professional-quality results makes it a staple in both home kitchens and artisan bakeries.
⚠️ Watch-outs & how to enjoy it better
As a refined carbohydrate with minimal fiber (0g/100g), it can cause rapid blood sugar spikes, making it less suitable for those managing diabetes or insulin resistance. To mitigate this, pair it with protein-rich fillings like nuts or eggs, or combine with whole-grain flours in a 1:1 ratio to boost fiber content. Also note it's a common gluten allergen, so those with celiac disease must avoid it entirely.
Key benefits
- Low protein content (8.75g/100g) ensures tender, non-chewy textures in pastries and cakes
- Fine milling creates a smooth, velvety batter for delicate baked goods
- Unbleached and unenriched means fewer processing steps and more natural wheat flavor
- High carbohydrate density provides quick energy for baking and cooking applications
- Versatile base for both sweet and savory preparations requiring a soft crumb
🍽️ Popular dishes




🌍 Where it's eaten
💡 Did you know?
Pastry flour is typically made from soft winter wheat varieties, which have lower protein content (8-9%) compared to hard wheat used for bread flour (12-14%), and this difference is why pastry flour creates tender textures while bread flour creates chewy ones.
Full nutrition (USDA data · scales with serving)
| Water | 11.9 g |
| Energy (Atwater General Factors) | 359 kcal |
| Energy (Atwater Specific Factors) | 367 kcal |
| Energy | 358 kcal |
| Energy | 1500 kj |
| Nitrogen | 1.4 g |
| Protein | 8.8 g |
| Total lipid (fat) | 1.6 g |
| Ash | 0.53 g |
| Carbohydrate, by difference | 77.2 g |
| Calcium, Ca | 17.0 mg |
| Iron, Fe | 0.87 mg |
| Magnesium, Mg | 22.4 mg |
| Phosphorus, P | 102 mg |
| Potassium, K | 142 mg |
| Sodium, Na | 1.0 mg |
| Zinc, Zn | 0.74 mg |
| Copper, Cu | 0.16 mg |
| Manganese, Mn | 0.64 mg |
| Selenium, Se | 5.0 ug |
| Molybdenum, Mo | 59.1 ug |
| Thiamin | 0.15 mg |
| Riboflavin | 0.00 mg |
| Niacin | 0.99 mg |
| Vitamin B-6 | 0.07 mg |
Fat & fatty acid profile (per 100g)
Estimated from Pasta, gluten-free, corn flour and quinoa flour, cooked, ANCIENT HARVEST — USDA does not publish this profile for Flour.
| Fatty acids, total saturated | 0.15 g |
| SFA 4:0 | 0.00 g |
| SFA 6:0 | 0.00 g |
| SFA 8:0 | 0.00 g |
| SFA 10:0 | 0.00 g |
| SFA 12:0 | 0.00 g |
| SFA 14:0 | 0.01 g |
| SFA 15:0 | 0.00 g |
| SFA 16:0 | 0.09 g |
| SFA 17:0 | 0.00 g |
| SFA 18:0 | 0.04 g |
| SFA 20:0 | 0.01 g |
| SFA 22:0 | 0.00 g |
| SFA 24:0 | 0.00 g |
| Fatty acids, total monounsaturated | 0.66 g |
| MUFA 14:1 | 0.00 g |
| MUFA 15:1 | 0.17 g |
| MUFA 16:1 | 0.00 g |
| MUFA 16:1 c | 0.00 g |
| MUFA 17:1 | 0.00 g |
| MUFA 18:1 | 0.48 g |
| MUFA 18:1 c | 0.47 g |
| MUFA 20:1 | 0.01 g |
| MUFA 22:1 | 0.00 g |
| MUFA 22:1 c | 0.00 g |
| MUFA 24:1 c | 0.00 g |
| Fatty acids, total polyunsaturated | 0.95 g |
| PUFA 18:2 | 0.91 g |
| PUFA 18:2 n-6 c,c | 0.91 g |
| PUFA 18:2 CLAs | 0.00 g |
| PUFA 18:3 | 0.03 g |
| PUFA 18:3 n-3 c,c,c (ALA) | 0.03 g |
| PUFA 18:3 n-6 c,c,c | 0.00 g |
| PUFA 18:3i | 0.00 g |
| PUFA 18:4 | 0.00 g |
| PUFA 20:2 n-6 c,c | 0.00 g |
| PUFA 20:3 | 0.00 g |
| PUFA 20:3 n-3 | 0.00 g |
| PUFA 20:3 n-6 | 0.00 g |
| PUFA 20:4 | 0.00 g |
| PUFA 20:5 n-3 (EPA) | 0.00 g |
| PUFA 22:4 | 0.00 g |
| PUFA 22:5 n-3 (DPA) | 0.00 g |
| PUFA 22:6 n-3 (DHA) | 0.00 g |
| Fatty acids, total trans | 0.01 g |
| Fatty acids, total trans-monoenoic | 0.00 g |
| TFA 16:1 t | 0.00 g |
| TFA 18:1 t | 0.00 g |
| TFA 22:1 t | 0.00 g |
| TFA 18:2 t not further defined | 0.00 g |
| Fatty acids, total trans-polyenoic | 0.00 g |
| Cholesterol | 0.00 mg |
Amino acid profile (per 100g)
Estimated from Pasta, gluten-free, corn flour and quinoa flour, cooked, ANCIENT HARVEST — USDA does not publish this profile for Flour.
| Tryptophan | 0.02 g |
| Threonine | 0.10 g |
| Isoleucine | 0.09 g |
| Leucine | 0.35 g |
| Lysine | 0.16 g |
| Methionine | 0.06 g |
| Cystine | 0.07 g |
| Phenylalanine | 0.15 g |
| Tyrosine | 0.12 g |
| Valine | 0.11 g |
| Arginine | 0.18 g |
| Histidine | 0.09 g |
| Alanine | 0.21 g |
| Aspartic acid | 0.19 g |
| Glutamic acid | 0.46 g |
| Glycine | 0.12 g |
| Proline | 0.29 g |
| Serine | 0.15 g |
| Hydroxyproline | 0.00 g |
FAQ
What's the difference between pastry flour and all-purpose flour?
Pastry flour has lower protein content (8-9% vs 10-12% in all-purpose), resulting in more tender baked goods. All-purpose flour is more versatile but can make pastries tougher if overmixed.
Can I substitute pastry flour for all-purpose flour in recipes?
Yes, but expect slightly more tender results. For a 1:1 substitute, use 1 cup pastry flour plus 2 tablespoons cornstarch to mimic the protein content of all-purpose flour.
Why is unbleached flour preferred over bleached?
Unbleached flour retains more natural nutrients and has a slightly nuttier flavor. Bleached flour is chemically treated to whiten it faster, which can reduce some vitamins and alter texture.
How should I store pastry flour?
Keep it in an airtight container in a cool, dark place for up to 6 months, or refrigerate for up to a year. This prevents rancidity and pest infestation.
Nutrient density (calculated · NRF9.3)
Nutrient Rich Foods index: beneficial nutrients (protein, fiber, vitamins, minerals) minus saturated fat, added sugar & sodium, per 100 kcal.
NRF9.3 index — Fulgoni, Keast & Drewnowski, 2009. Computed from USDA nutrients.
Weight-loss friendliness (composite index)
Energy density 3.58 kcal/g · 10% calories from protein · 0.0 g fiber · 0.0 g sugar per 100 g.
Composite of energy density (Rolls et al., 1999), protein & fiber satiety, minus sugar. A calculated heuristic — ranks satiety-per-calorie, not a clinical measure.
Dietary load (calculated from USDA values)
Potential renal acid load. Positive = acid-forming, negative = alkaline-forming.
Sodium-to-potassium ratio: 0.01 (lower is better — aim for ≤ 1)
Sodium:potassium per WHO potassium guidance. Computed from USDA nutrients.