

Corn, sweet, white, cooked, boiled, drained, with salt
Whole food · Vegetables and Vegetable Products

Photo: Wikipedia
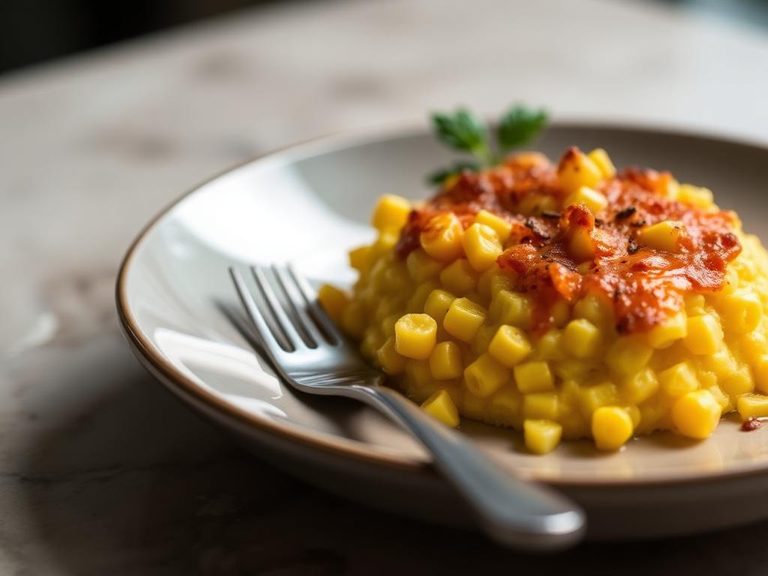
Boiled white sweet corn kernels are plump, juicy, and tender-crisp, offering a clean, milky sweetness with a satisfying pop. Nutritionally, it's a low-fat, high-fiber carbohydrate source, providing steady energy and essential minerals like magnesium. The simple preparation with a pinch of salt enhances its natural, bright flavor without adding complexity.
Calorie split: 12% protein · 77% carbs · 11% fat
↓ Full nutrition💚 Why it's loved
People adore its inherent, comforting sweetness and the satisfying textural contrast between the tender kernel and the slight pop of the skin. It's a beloved, versatile staple that can be a simple side, a vibrant salad ingredient, or a hearty soup component.
⚠️ Watch-outs & how to enjoy it better
Its high carbohydrate content can cause blood sugar spikes, especially for those with diabetes or insulin resistance. The added salt increases sodium intake, which may be a concern for blood pressure management. To mitigate, pair it with a protein like grilled chicken or a healthy fat like avocado, and opt for low-sodium cooking or rinse after boiling.
Key benefits
- Excellent source of dietary fiber for digestive health.
- Provides complex carbohydrates for sustained energy.
- Contains antioxidants like lutein and zeaxanthin for eye health.
- Low in fat and naturally cholesterol-free.
- Good source of magnesium and potassium.
🍽️ Popular dishes
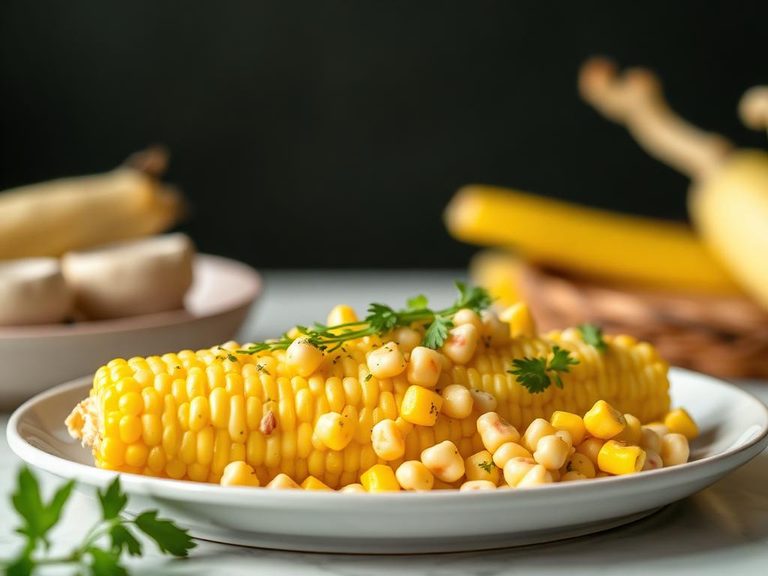
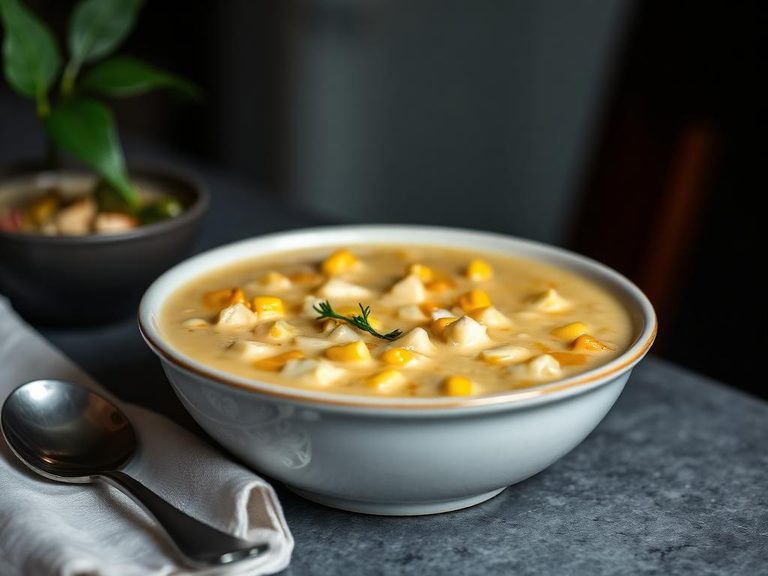
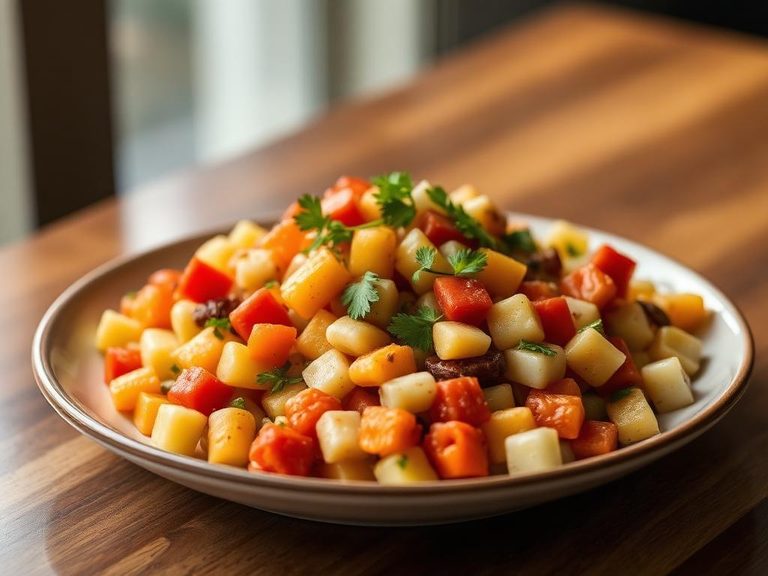
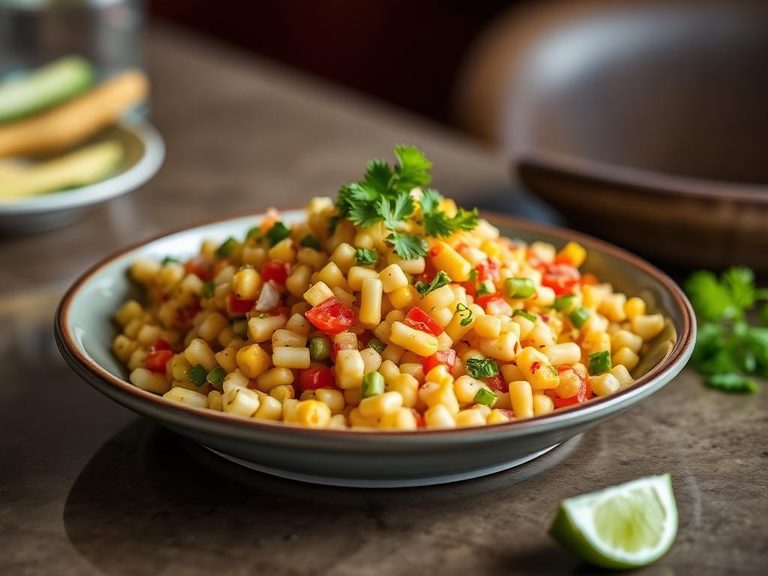
🌍 Where it's eaten
💡 Did you know?
The average ear of corn has about 800 kernels arranged in 16 rows, and each silk thread corresponds to a single kernel on the cob.
Full nutrition (USDA data · scales with serving)
| Water | 72.8 g |
| Energy | 97.0 kcal |
| Energy | 408 kj |
| Protein | 3.3 g |
| Total lipid (fat) | 1.4 g |
| Ash | 0.70 g |
| Carbohydrate, by difference | 21.7 g |
| Fiber, total dietary | 2.7 g |
| Total Sugars | 7.7 g |
| Sucrose | 6.0 g |
| Glucose | 0.70 g |
| Fructose | 1.0 g |
| Lactose | 0.00 g |
| Maltose | 0.00 g |
| Galactose | 0.00 g |
| Starch | 4.5 g |
| Calcium, Ca | 2.0 mg |
| Iron, Fe | 0.55 mg |
| Magnesium, Mg | 31.0 mg |
| Phosphorus, P | 92.0 mg |
| Potassium, K | 252 mg |
| Sodium, Na | 253 mg |
| Zinc, Zn | 0.54 mg |
| Copper, Cu | 0.06 mg |
| Manganese, Mn | 0.21 mg |
| Selenium, Se | 0.80 ug |
| Vitamin C, total ascorbic acid | 6.2 mg |
| Thiamin | 0.09 mg |
| Riboflavin | 0.05 mg |
| Niacin | 1.7 mg |
| Pantothenic acid | 0.75 mg |
| Vitamin B-6 | 0.13 mg |
| Folate, total | 20.0 ug |
| Folic acid | 0.00 ug |
| Folate, food | 20.0 ug |
| Folate, DFE | 20.0 ug |
| Choline, total | 29.1 mg |
| Vitamin B-12 | 0.00 ug |
| Vitamin B-12, added | 0.00 ug |
| Vitamin A, RAE | 0.00 ug |
| Retinol | 0.00 ug |
| Carotene, beta | 1.0 ug |
| Carotene, alpha | 0.00 ug |
| Cryptoxanthin, beta | 0.00 ug |
| Vitamin A, IU | 2.0 iu |
| Lycopene | 0.00 ug |
| Lutein + zeaxanthin | 43.0 ug |
| Vitamin E (alpha-tocopherol) | 0.09 mg |
| Vitamin E, added | 0.00 mg |
| Vitamin D (D2 + D3), International Units | 0.00 iu |
| Vitamin D (D2 + D3) | 0.00 ug |
| Vitamin K (phylloquinone) | 0.40 ug |
| Alcohol, ethyl | 0.00 g |
| Caffeine | 0.00 mg |
| Theobromine | 0.00 mg |
Fat & fatty acid profile (per 100g)
| Fatty acids, total saturated | 0.20 g |
| SFA 4:0 | 0.00 g |
| SFA 6:0 | 0.00 g |
| SFA 8:0 | 0.00 g |
| SFA 10:0 | 0.00 g |
| SFA 12:0 | 0.00 g |
| SFA 14:0 | 0.00 g |
| SFA 16:0 | 0.18 g |
| SFA 18:0 | 0.01 g |
| Fatty acids, total monounsaturated | 0.37 g |
| MUFA 16:1 | 0.00 g |
| MUFA 18:1 | 0.37 g |
| MUFA 20:1 | 0.00 g |
| MUFA 22:1 | 0.00 g |
| Fatty acids, total polyunsaturated | 0.60 g |
| PUFA 18:2 | 0.59 g |
| PUFA 18:3 | 0.02 g |
| PUFA 18:4 | 0.00 g |
| PUFA 20:4 | 0.00 g |
| PUFA 20:5 n-3 (EPA) | 0.00 g |
| PUFA 22:5 n-3 (DPA) | 0.00 g |
| PUFA 22:6 n-3 (DHA) | 0.00 g |
| Fatty acids, total trans | 0.00 g |
| Cholesterol | 0.00 mg |
Amino acid profile (per 100g)
| Tryptophan | 0.02 g |
| Threonine | 0.13 g |
| Isoleucine | 0.13 g |
| Leucine | 0.36 g |
| Lysine | 0.14 g |
| Methionine | 0.07 g |
| Cystine | 0.03 g |
| Phenylalanine | 0.15 g |
| Tyrosine | 0.13 g |
| Valine | 0.19 g |
| Arginine | 0.14 g |
| Histidine | 0.09 g |
| Alanine | 0.30 g |
| Aspartic acid | 0.25 g |
| Glutamic acid | 0.66 g |
| Glycine | 0.13 g |
| Proline | 0.30 g |
| Serine | 0.16 g |
FAQ
Is boiled corn a good source of protein?
While it contains some protein (about 3.3g per 100g), it is not considered a high-protein food. It's best viewed as a carbohydrate-rich vegetable that contributes to overall protein intake.
Nutrient density (calculated · NRF9.3)
Nutrient Rich Foods index: beneficial nutrients (protein, fiber, vitamins, minerals) minus saturated fat, added sugar & sodium, per 100 kcal.
NRF9.3 index — Fulgoni, Keast & Drewnowski, 2009. Computed from USDA nutrients.
Weight-loss friendliness (composite index)
Energy density 0.97 kcal/g · 14% calories from protein · 2.7 g fiber · 7.7 g sugar per 100 g.
Composite of energy density (Rolls et al., 1999), protein & fiber satiety, minus sugar. A calculated heuristic — ranks satiety-per-calorie, not a clinical measure.
Dietary load (calculated from USDA values)
Potential renal acid load. Positive = acid-forming, negative = alkaline-forming.
Sodium-to-potassium ratio: 1.00 (lower is better — aim for ≤ 1)
Sodium:potassium per WHO potassium guidance. Computed from USDA nutrients.