

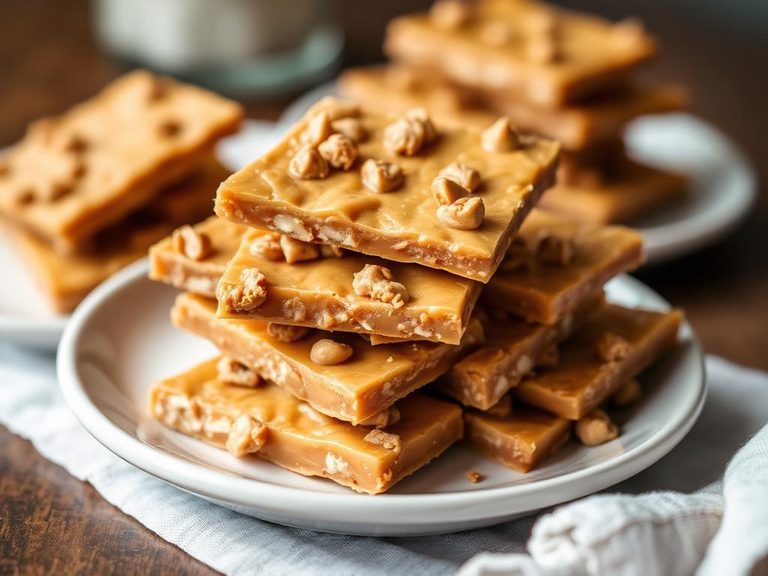
Candies, crispy bar with peanut butter filling
Whole food · Sweets

Photo: Wikipedia
This candy bar is a textural marvel, featuring a shatteringly crisp, airy wafer or cereal shell that gives way to a rich, creamy peanut butter filling. The contrast between the light, crunchy exterior and the dense, salty-sweet interior is its signature appeal. Nutritionally, it's a high-energy treat, packing over 540 calories per 100g, with the majority of its energy coming from fats and carbohydrates.
Calorie split: 7% protein · 41% carbs · 52% fat
↓ Full nutrition💚 Why it's loved
People love it for the addictive combination of salty and sweet flavors, and the dramatic crunch that precedes the smooth peanut butter center. It's a nostalgic, portable comfort food often enjoyed as a quick energy boost or a classic movie snack.
⚠️ Watch-outs & how to enjoy it better
Its high sugar (40.33g/100g) and calorie content make it unsuitable for frequent consumption, especially for those managing blood sugar or weight. The primary allergen is peanuts. To enjoy mindfully, practice strict portion control (e.g., one small piece) and pair it with a source of fiber or additional protein (like a piece of fruit or a handful of nuts) to slow sugar absorption.
Key benefits
- Provides a quick, dense source of energy (542 kcal/100g).
- Contains plant-based protein from peanut butter (9.53g/100g).
- Offers a satisfying textural contrast (crispy vs. creamy).
- The fat content (31.34g/100g) contributes to flavor and satiety.
🍽️ Popular dishes
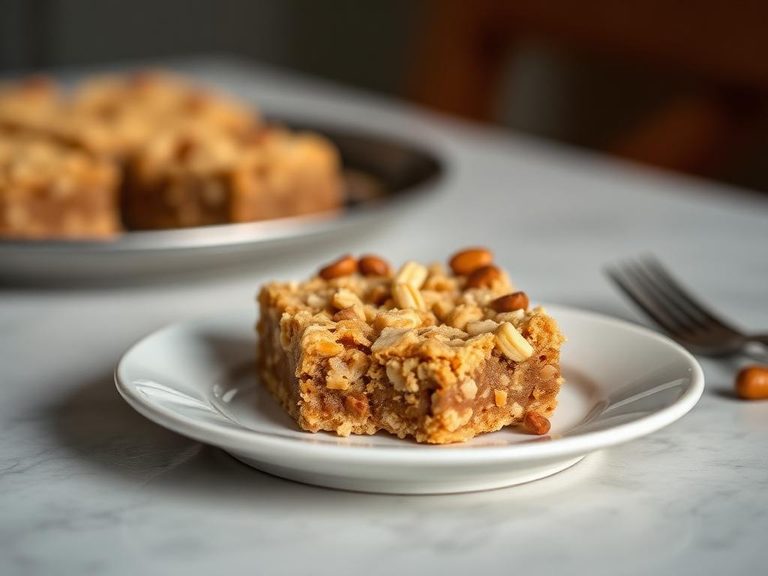
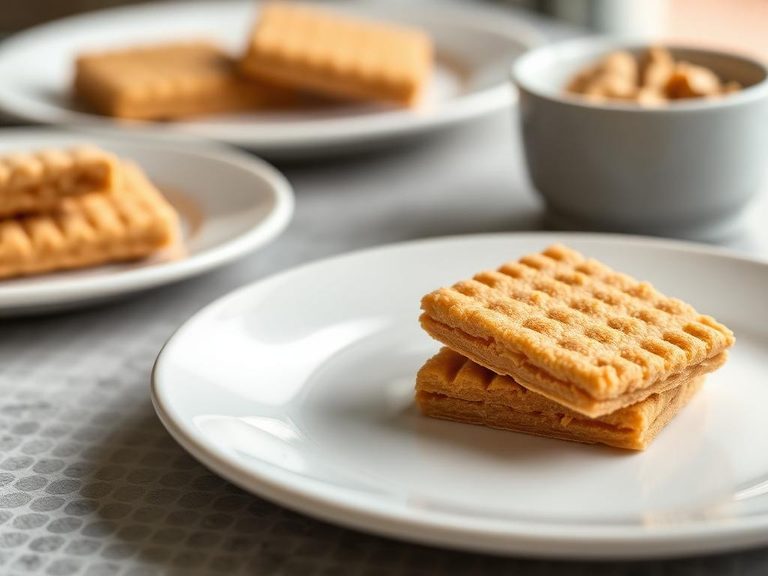
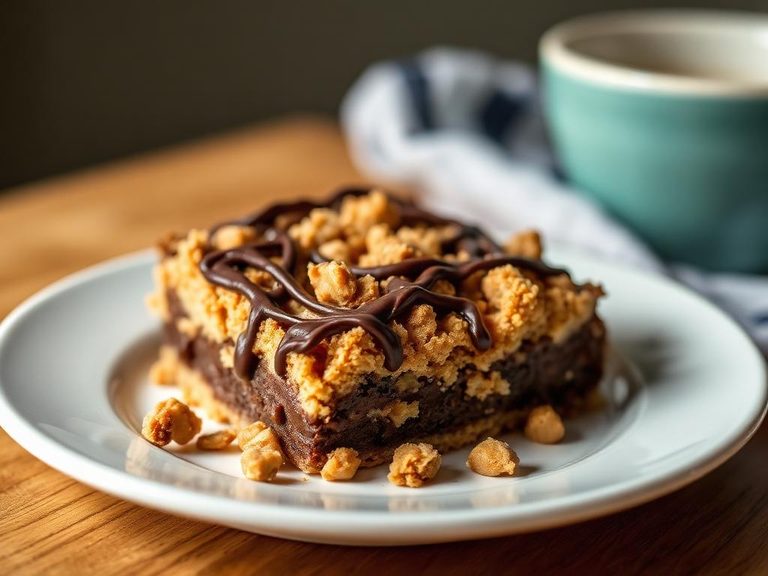
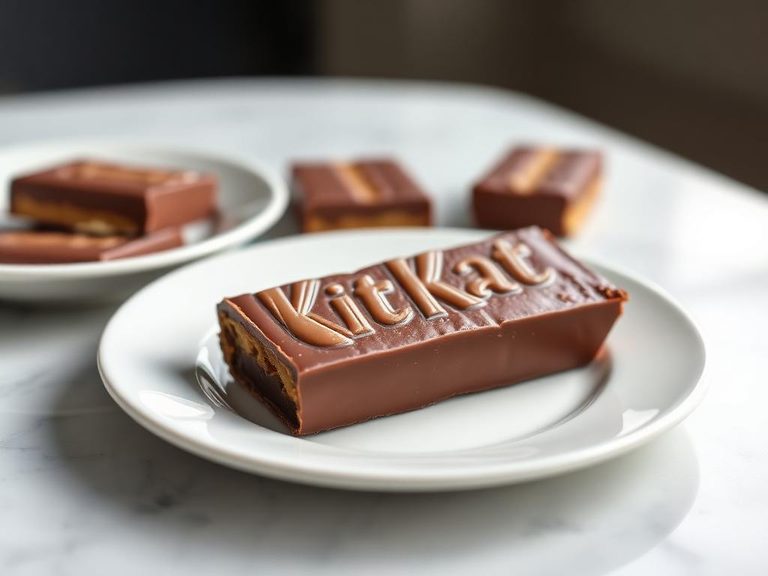
🌍 Where it's eaten
💡 Did you know?
The 'crispy' texture is often achieved by aerating the sugar mixture during manufacturing, creating tiny air pockets that shatter when bitten, similar to the science behind honeycomb toffee.
Full nutrition (USDA data · scales with serving)
| Water | 1.6 g |
| Energy | 542 kcal |
| Energy | 2269 kj |
| Protein | 9.5 g |
| Total lipid (fat) | 31.3 g |
| Ash | 2.0 g |
| Carbohydrate, by difference | 55.5 g |
| Fiber, total dietary | 3.3 g |
| Total Sugars | 40.3 g |
| Calcium, Ca | 70.0 mg |
| Iron, Fe | 1.3 mg |
| Magnesium, Mg | 49.0 mg |
| Phosphorus, P | 144 mg |
| Potassium, K | 295 mg |
| Sodium, Na | 264 mg |
| Zinc, Zn | 0.99 mg |
| Copper, Cu | 0.20 mg |
| Manganese, Mn | 0.00 mg |
| Selenium, Se | 0.70 ug |
| Vitamin C, total ascorbic acid | 0.60 mg |
| Thiamin | 0.13 mg |
| Riboflavin | 0.10 mg |
| Niacin | 3.6 mg |
| Pantothenic acid | 0.44 mg |
| Vitamin B-6 | 0.08 mg |
| Folate, total | 40.0 ug |
| Folic acid | 40.0 ug |
| Folate, food | 0.00 ug |
| Folate, DFE | 68.0 ug |
| Choline, total | 28.2 mg |
| Vitamin B-12 | 0.15 ug |
| Vitamin B-12, added | 0.00 ug |
| Vitamin A, RAE | 15.0 ug |
| Retinol | 15.0 ug |
| Carotene, beta | 4.0 ug |
| Carotene, alpha | 0.00 ug |
| Cryptoxanthin, beta | 0.00 ug |
| Vitamin A, IU | 58.0 iu |
| Lycopene | 0.00 ug |
| Lutein + zeaxanthin | 45.0 ug |
| Vitamin E (alpha-tocopherol) | 2.8 mg |
| Vitamin E, added | 0.00 mg |
| Vitamin D (D2 + D3), International Units | 0.00 iu |
| Vitamin D (D2 + D3) | 0.00 ug |
| Vitamin K (phylloquinone) | 5.9 ug |
| Alcohol, ethyl | 0.00 g |
| Caffeine | 0.00 mg |
| Theobromine | 48.0 mg |
Fat & fatty acid profile (per 100g)
| Fatty acids, total saturated | 13.0 g |
| SFA 4:0 | 0.12 g |
| SFA 6:0 | 0.04 g |
| SFA 8:0 | 0.04 g |
| SFA 10:0 | 0.06 g |
| SFA 12:0 | 0.22 g |
| SFA 13:0 | 0.00 g |
| SFA 14:0 | 0.24 g |
| SFA 15:0 | 0.02 g |
| SFA 16:0 | 6.0 g |
| SFA 17:0 | 0.01 g |
| SFA 18:0 | 6.2 g |
| SFA 20:0 | 0.04 g |
| SFA 22:0 | 0.00 g |
| SFA 24:0 | 0.00 g |
| Fatty acids, total monounsaturated | 10.8 g |
| MUFA 14:1 | 0.01 g |
| MUFA 15:1 | 0.00 g |
| MUFA 16:1 | 0.05 g |
| MUFA 17:1 | 0.00 g |
| MUFA 18:1 | 9.3 g |
| MUFA 20:1 | 0.11 g |
| MUFA 22:1 | 0.00 g |
| MUFA 24:1 c | 0.00 g |
| Fatty acids, total polyunsaturated | 4.7 g |
| PUFA 18:2 | 4.6 g |
| PUFA 18:3 | 0.05 g |
| PUFA 18:4 | 0.00 g |
| PUFA 20:2 n-6 c,c | 0.00 g |
| PUFA 20:3 | 0.00 g |
| PUFA 20:4 | 0.00 g |
| PUFA 20:5 n-3 (EPA) | 0.00 g |
| PUFA 22:5 n-3 (DPA) | 0.00 g |
| PUFA 22:6 n-3 (DHA) | 0.00 g |
| Fatty acids, total trans | 0.02 g |
| Cholesterol | 5.0 mg |
Amino acid profile (per 100g)
Estimated from Candies, honey-combed, with peanut butter — USDA does not publish this profile for Candies.
| Tryptophan | 0.09 g |
| Threonine | 0.21 g |
| Isoleucine | 0.24 g |
| Leucine | 0.61 g |
| Lysine | 0.27 g |
| Methionine | 0.10 g |
| Cystine | 0.09 g |
| Phenylalanine | 0.47 g |
| Tyrosine | 0.33 g |
| Valine | 0.31 g |
| Arginine | 1.1 g |
| Histidine | 0.22 g |
| Alanine | 0.36 g |
| Aspartic acid | 1.2 g |
| Glutamic acid | 2.0 g |
| Glycine | 0.56 g |
| Proline | 0.55 g |
| Serine | 0.58 g |
FAQ
What makes it crispy?
The crispy texture typically comes from a puffed wheat or rice cereal base, or an aerated sugar/wafer layer that is light and brittle.
Is it a good source of protein?
While it contains some protein from peanut butter (9.53g/100g), it is not considered a significant protein source due to its very high sugar and fat content.
How does it compare nutritionally to a regular peanut butter sandwich?
It is much more calorie-dense and sugary. A sandwich on whole-grain bread provides more fiber, less added sugar, and a better balance of nutrients.
Nutrient density (calculated · NRF9.3)
Nutrient Rich Foods index: beneficial nutrients (protein, fiber, vitamins, minerals) minus saturated fat, added sugar & sodium, per 100 kcal.
NRF9.3 index — Fulgoni, Keast & Drewnowski, 2009. Computed from USDA nutrients.
Weight-loss friendliness (composite index)
Energy density 5.42 kcal/g · 7% calories from protein · 3.3 g fiber · 40.3 g sugar per 100 g.
Composite of energy density (Rolls et al., 1999), protein & fiber satiety, minus sugar. A calculated heuristic — ranks satiety-per-calorie, not a clinical measure.
Dietary load (calculated from USDA values)
Potential renal acid load. Positive = acid-forming, negative = alkaline-forming.
Sodium-to-potassium ratio: 0.89 (lower is better — aim for ≤ 1)
Sodium:potassium per WHO potassium guidance. Computed from USDA nutrients.