

Soup, onion, dry, mix, prepared with water
Whole food · Soups, Sauces, and Gravies

Photo: Wikipedia
This is a dehydrated, powdered mix of onion and other ingredients that transforms into a light, savory broth when reconstituted with water. It delivers a distinct, sweet onion flavor with a slightly salty, umami-rich profile and a clear, thin texture. Nutritionally, it is extremely low in calories and fat, providing a modest amount of carbohydrates and minimal protein.
Calorie split: 10% protein · 89% carbs · 1% fat
↓ Full nutrition💚 Why it's loved
People love it for its instant, reliable onion flavor that forms the backbone of countless soups, gravies, and stews without the prep work of chopping and caramelizing fresh onions. Its versatility and long shelf life make it a go-to for quick, comforting meals.
⚠️ Watch-outs & how to enjoy it better
The primary downside is often high sodium content in many commercial mixes, which can contribute to fluid retention. To counteract this, choose low-sodium versions, use it sparingly, and pair it with potassium-rich foods like fresh vegetables or a side of fruit. Also, some mixes may contain additives or allergens like wheat or soy, so checking labels is crucial.
Key benefits
- Extremely low calorie density (12 kcal/100g)
- Virtually fat-free (0.01g/100g)
- Provides a quick, savory base for soups and sauces
- Convenient and shelf-stable pantry staple
- Low in sugar (0.2g/100g)
🍽️ Popular dishes
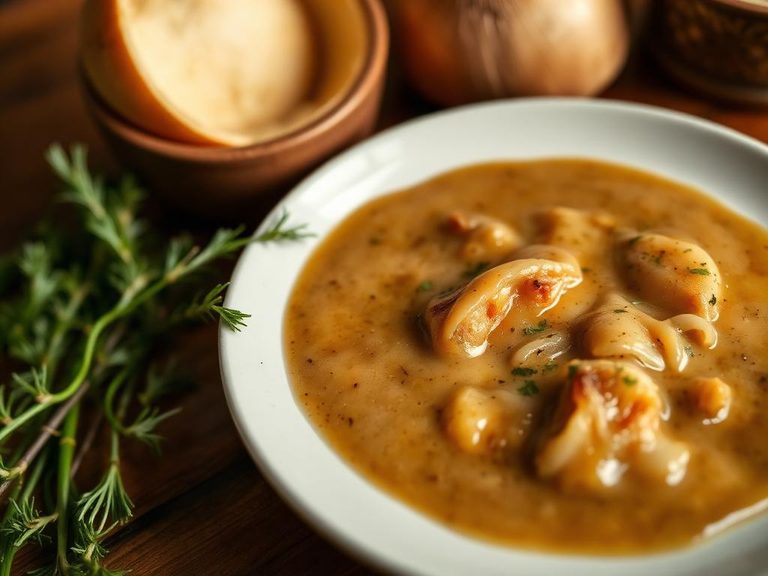

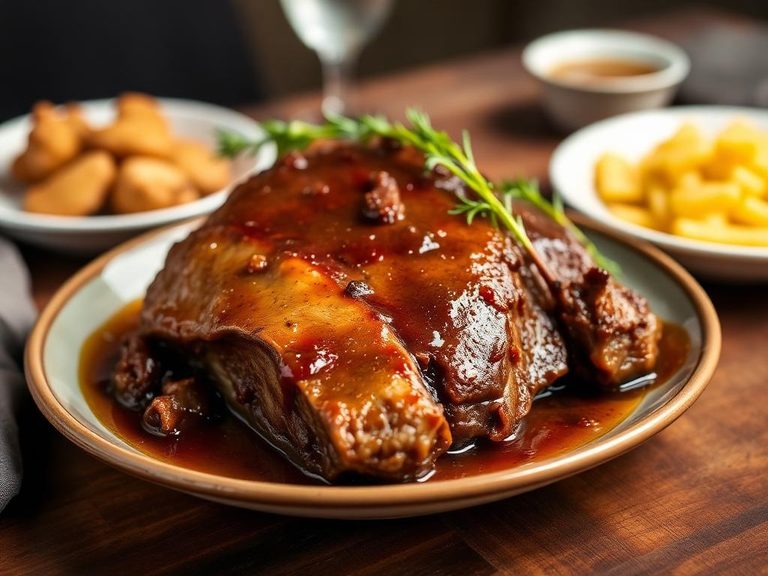
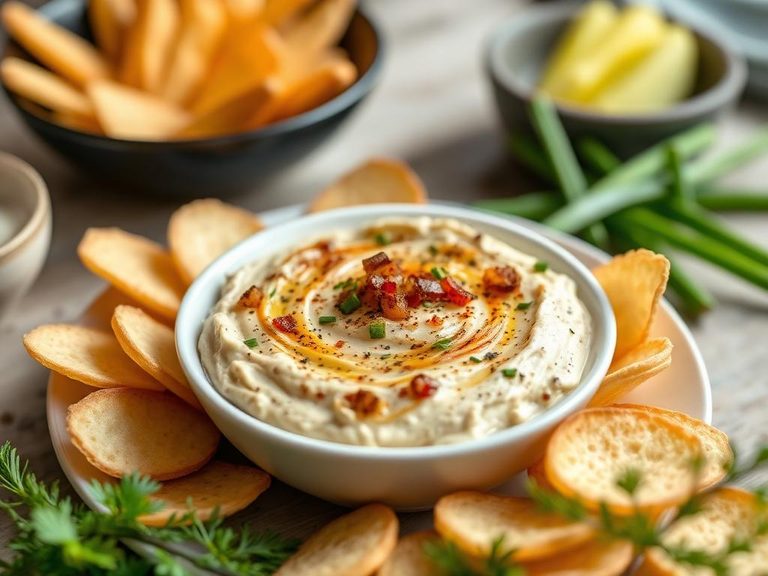
🌍 Where it's eaten
💡 Did you know?
The process of dehydrating onions concentrates their natural sugars, making the resulting powder significantly sweeter than fresh onion, which is why it's often used in spice blends and snack seasonings.
Full nutrition (USDA data · scales with serving)
| Water | 95.8 g |
| Energy | 12.0 kcal |
| Energy | 52.0 kj |
| Protein | 0.32 g |
| Total lipid (fat) | 0.01 g |
| Ash | 1.1 g |
| Carbohydrate, by difference | 2.8 g |
| Fiber, total dietary | 0.30 g |
| Total Sugars | 0.20 g |
| Calcium, Ca | 9.0 mg |
| Iron, Fe | 0.05 mg |
| Magnesium, Mg | 4.0 mg |
| Phosphorus, P | 9.0 mg |
| Potassium, K | 31.0 mg |
| Sodium, Na | 346 mg |
| Zinc, Zn | 0.05 mg |
| Copper, Cu | 0.03 mg |
| Manganese, Mn | 0.03 mg |
| Selenium, Se | 0.20 ug |
| Vitamin C, total ascorbic acid | 0.10 mg |
| Thiamin | 0.01 mg |
| Riboflavin | 0.01 mg |
| Niacin | 0.06 mg |
| Pantothenic acid | 0.04 mg |
| Vitamin B-6 | 0.03 mg |
| Folate, total | 0.00 ug |
| Folic acid | 0.00 ug |
| Folate, food | 0.00 ug |
| Folate, DFE | 0.00 ug |
| Choline, total | 1.2 mg |
| Vitamin B-12 | 0.00 ug |
| Vitamin B-12, added | 0.00 ug |
| Vitamin A, RAE | 0.00 ug |
| Retinol | 0.00 ug |
| Carotene, beta | 0.00 ug |
| Carotene, alpha | 0.00 ug |
| Cryptoxanthin, beta | 0.00 ug |
| Vitamin A, IU | 1.0 iu |
| Lycopene | 0.00 ug |
| Lutein + zeaxanthin | 1.0 ug |
| Vitamin E (alpha-tocopherol) | 0.01 mg |
| Vitamin E, added | 0.00 mg |
| Tocopherol, beta | 0.00 mg |
| Vitamin D (D2 + D3), International Units | 0.00 iu |
| Vitamin D (D2 + D3) | 0.00 ug |
| Vitamin K (phylloquinone) | 0.10 ug |
| Alcohol, ethyl | 0.00 g |
| Caffeine | 0.00 mg |
| Theobromine | 0.00 mg |
Fat & fatty acid profile (per 100g)
| Fatty acids, total saturated | 0.00 g |
| SFA 4:0 | 0.00 g |
| SFA 6:0 | 0.00 g |
| SFA 8:0 | 0.00 g |
| SFA 10:0 | 0.00 g |
| SFA 12:0 | 0.00 g |
| SFA 13:0 | 0.00 g |
| SFA 14:0 | 0.00 g |
| SFA 15:0 | 0.00 g |
| SFA 16:0 | 0.00 g |
| SFA 17:0 | 0.00 g |
| SFA 18:0 | 0.00 g |
| SFA 20:0 | 0.00 g |
| SFA 22:0 | 0.00 g |
| SFA 24:0 | 0.00 g |
| Fatty acids, total monounsaturated | 0.00 g |
| MUFA 15:1 | 0.00 g |
| MUFA 16:1 | 0.00 g |
| MUFA 17:1 | 0.00 g |
| MUFA 18:1 | 0.00 g |
| MUFA 20:1 | 0.00 g |
| MUFA 22:1 | 0.00 g |
| Fatty acids, total polyunsaturated | 0.01 g |
| PUFA 18:2 | 0.01 g |
| PUFA 18:3 | 0.00 g |
| PUFA 18:4 | 0.00 g |
| PUFA 20:2 n-6 c,c | 0.00 g |
| PUFA 20:4 | 0.00 g |
| PUFA 20:5 n-3 (EPA) | 0.00 g |
| PUFA 22:5 n-3 (DPA) | 0.00 g |
| PUFA 22:6 n-3 (DHA) | 0.00 g |
| Cholesterol | 0.00 mg |
Amino acid profile (per 100g)
Estimated from Soup, bean with pork, canned, condensed — USDA does not publish this profile for Soup.
| Tryptophan | 0.06 g |
| Threonine | 0.24 g |
| Isoleucine | 0.29 g |
| Leucine | 0.48 g |
| Lysine | 0.40 g |
| Methionine | 0.07 g |
| Cystine | 0.07 g |
| Phenylalanine | 0.33 g |
| Tyrosine | 0.18 g |
| Valine | 0.32 g |
| Arginine | 0.31 g |
| Histidine | 0.15 g |
| Alanine | 0.29 g |
| Aspartic acid | 0.66 g |
| Glutamic acid | 1.1 g |
| Glycine | 0.28 g |
| Proline | 0.27 g |
| Serine | 0.29 g |
FAQ
How does the nutrition differ from fresh onion?
Per 100g, dry mix is far more calorie-dense and contains less water and fiber than fresh onion. However, a typical serving (e.g., 15g) reconstituted into soup is very low-calorie, similar to a light broth.
Is it gluten-free?
Not always. Many commercial mixes contain wheat flour or other gluten-containing ingredients as thickeners or flavor enhancers. Always check the ingredient list for a certified gluten-free label if needed.
Can I use it in place of fresh onions?
It works best for adding onion flavor to liquids (soups, sauces, gravies) but won't provide the same texture or caramelized depth as fresh onions. It's a flavor booster, not a direct substitute for the vegetable itself.
How much sodium is in a typical serving?
Sodium content varies widely by brand, but a single packet can contain 300-800mg of sodium, which is 13-35% of the daily value. Opt for low-sodium versions if monitoring salt intake.
Nutrient density (calculated · NRF9.3)
Nutrient Rich Foods index: beneficial nutrients (protein, fiber, vitamins, minerals) minus saturated fat, added sugar & sodium, per 100 kcal.
NRF9.3 index — Fulgoni, Keast & Drewnowski, 2009. Computed from USDA nutrients.
Weight-loss friendliness (composite index)
Energy density 0.12 kcal/g · 11% calories from protein · 0.3 g fiber · 0.2 g sugar per 100 g.
Composite of energy density (Rolls et al., 1999), protein & fiber satiety, minus sugar. A calculated heuristic — ranks satiety-per-calorie, not a clinical measure.
Dietary load (calculated from USDA values)
Potential renal acid load. Positive = acid-forming, negative = alkaline-forming.
Sodium-to-potassium ratio: 11.16 (lower is better — aim for ≤ 1)
Sodium:potassium per WHO potassium guidance. Computed from USDA nutrients.