

Cheese, muenster, low fat
Whole food · Dairy and Egg Products

Photo: Wikipedia
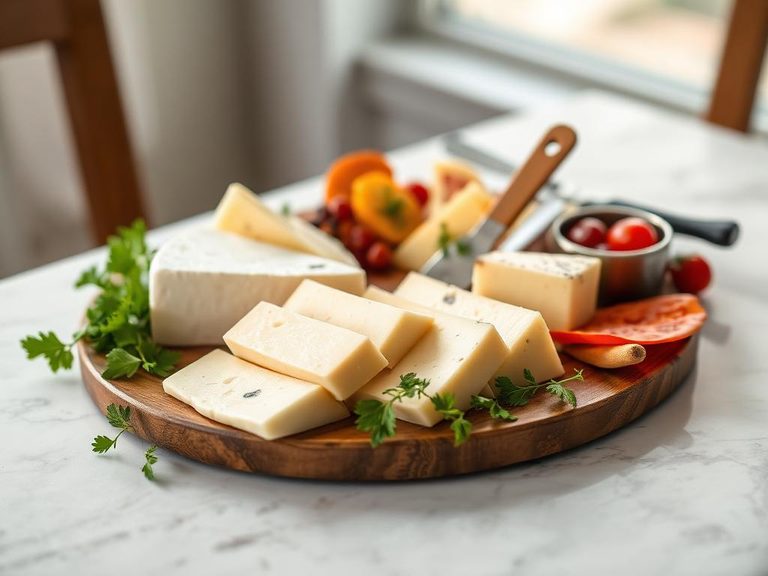
Low-fat Muenster is a semi-soft, orange-rinded cheese with a mild, buttery flavor and a smooth, pliable texture that melts beautifully. It is a lighter version of the classic, offering a substantial 24.7g of protein per 100g while significantly reducing fat content. Its gentle taste makes it incredibly versatile, from sandwiches to baked dishes.
Calorie split: 36% protein · 5% carbs · 58% fat
↓ Full nutrition💚 Why it's loved
People love it for its exceptional meltability and mild, buttery flavor that complements rather than overpowers other ingredients. It's a go-to for creating creamy, satisfying textures in everything from grilled cheese to casseroles.
⚠️ Watch-outs & how to enjoy it better
As a cheese, it can be high in sodium, which may be a concern for those monitoring intake. To counteract, pair it with potassium-rich foods like leafy greens or use it sparingly as a flavorful accent rather than the main component.
Key benefits
- High in protein (24.7g per 100g) for muscle maintenance.
- Significantly lower in fat than traditional Muenster.
- Good source of calcium for bone health.
- Melts smoothly without excessive oiliness.
- Mild flavor profile appeals to a wide range of palates.
🍽️ Popular dishes
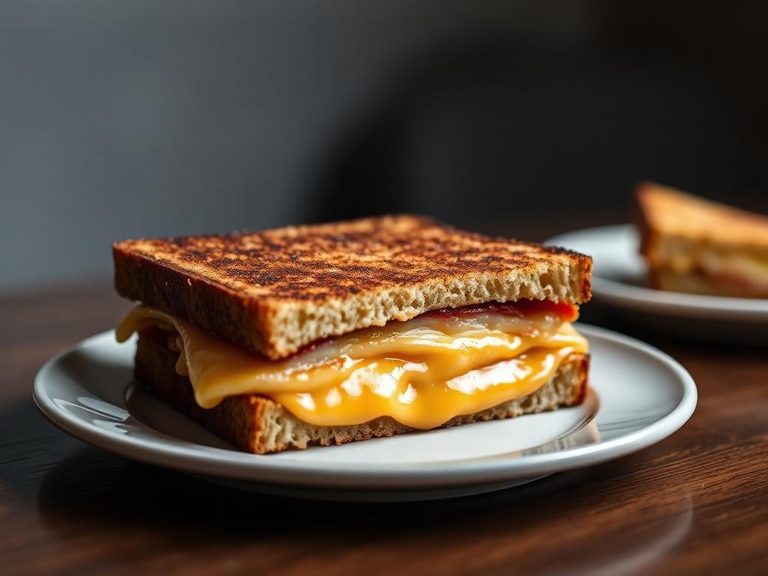
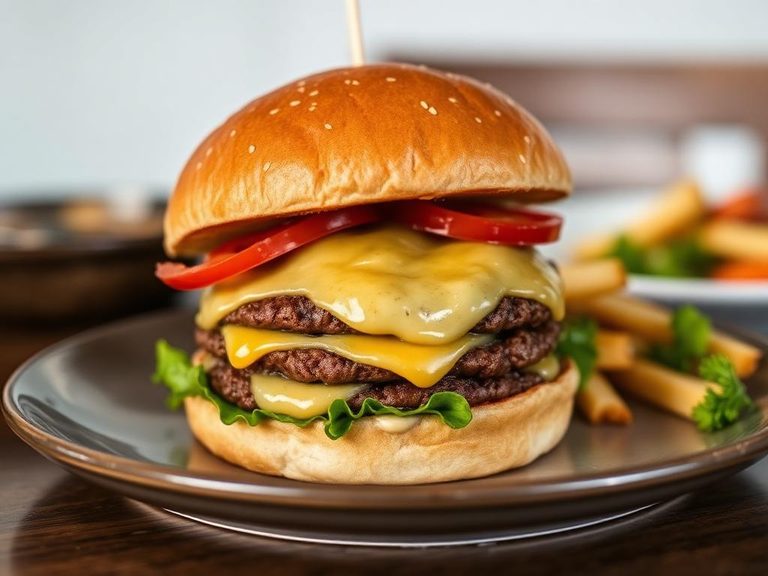
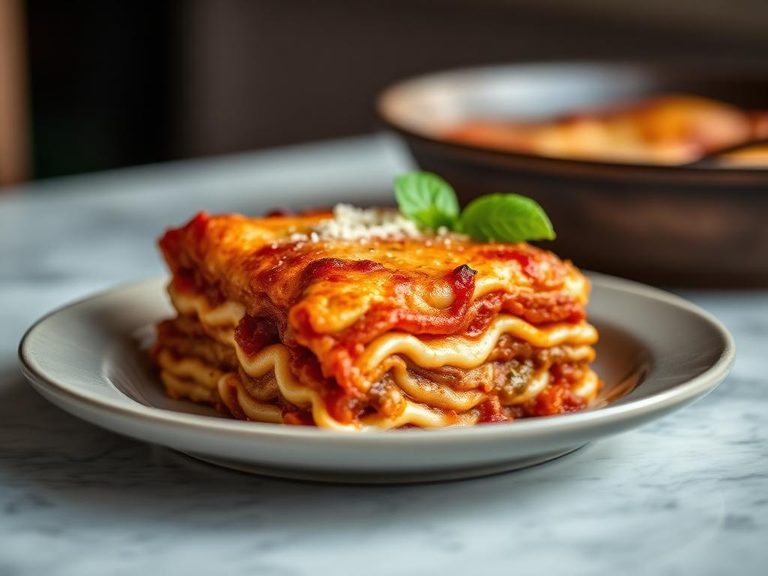
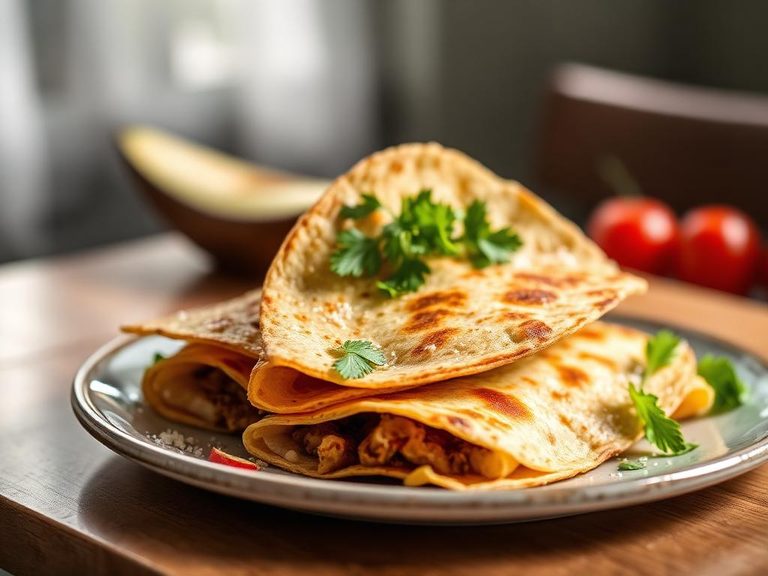

🌍 Where it's eaten
💡 Did you know?
The distinctive orange rind on Muenster cheese is not from the cheese itself, but from a vegetable-based dye (annatto) applied to the exterior during the aging process.
Full nutrition (USDA data · scales with serving)
| Water | 50.5 g |
| Energy | 271 kcal |
| Energy | 1135 kj |
| Protein | 24.7 g |
| Total lipid (fat) | 17.6 g |
| Ash | 3.7 g |
| Carbohydrate, by difference | 3.5 g |
| Fiber, total dietary | 0.00 g |
| Total Sugars | 3.5 g |
| Calcium, Ca | 529 mg |
| Iron, Fe | 0.41 mg |
| Magnesium, Mg | 27.0 mg |
| Phosphorus, P | 468 mg |
| Potassium, K | 134 mg |
| Sodium, Na | 600 mg |
| Zinc, Zn | 2.8 mg |
| Copper, Cu | 0.03 mg |
| Selenium, Se | 14.5 ug |
| Vitamin C, total ascorbic acid | 0.00 mg |
| Thiamin | 0.01 mg |
| Riboflavin | 0.36 mg |
| Niacin | 0.10 mg |
| Vitamin B-6 | 0.06 mg |
| Folate, total | 12.0 ug |
| Folic acid | 0.00 ug |
| Folate, food | 12.0 ug |
| Folate, DFE | 12.0 ug |
| Choline, total | 15.4 mg |
| Vitamin B-12 | 1.5 ug |
| Vitamin B-12, added | 0.00 ug |
| Vitamin A, RAE | 175 ug |
| Retinol | 174 ug |
| Carotene, beta | 8.0 ug |
| Carotene, alpha | 0.00 ug |
| Cryptoxanthin, beta | 0.00 ug |
| Vitamin A, IU | 593 iu |
| Lycopene | 0.00 ug |
| Lutein + zeaxanthin | 0.00 ug |
| Vitamin E (alpha-tocopherol) | 0.15 mg |
| Vitamin E, added | 0.00 mg |
| Vitamin D (D2 + D3), International Units | 13.0 iu |
| Vitamin D (D2 + D3) | 0.30 ug |
| Vitamin D3 (cholecalciferol) | 0.30 ug |
| Vitamin K (phylloquinone) | 1.5 ug |
| Alcohol, ethyl | 0.00 g |
| Caffeine | 0.00 mg |
| Theobromine | 0.00 mg |
Fat & fatty acid profile (per 100g)
| Fatty acids, total saturated | 10.9 g |
| SFA 4:0 | 0.57 g |
| SFA 6:0 | 0.34 g |
| SFA 8:0 | 0.20 g |
| SFA 10:0 | 0.44 g |
| SFA 12:0 | 0.49 g |
| SFA 14:0 | 1.8 g |
| SFA 16:0 | 4.6 g |
| SFA 18:0 | 2.1 g |
| Fatty acids, total monounsaturated | 5.1 g |
| MUFA 16:1 | 0.39 g |
| MUFA 18:1 | 4.4 g |
| MUFA 20:1 | 0.27 g |
| MUFA 22:1 | 0.00 g |
| Fatty acids, total polyunsaturated | 0.65 g |
| PUFA 18:2 | 0.40 g |
| PUFA 18:3 | 0.26 g |
| PUFA 18:4 | 0.00 g |
| PUFA 20:4 | 0.00 g |
| PUFA 20:5 n-3 (EPA) | 0.00 g |
| PUFA 22:5 n-3 (DPA) | 0.00 g |
| PUFA 22:6 n-3 (DHA) | 0.00 g |
| Cholesterol | 63.0 mg |
Amino acid profile (per 100g)
Estimated from Cheese, cottage, with vegetables — USDA does not publish this profile for Cheese.
| Tryptophan | 0.13 g |
| Threonine | 0.53 g |
| Isoleucine | 0.70 g |
| Leucine | 1.2 g |
| Lysine | 0.97 g |
| Methionine | 0.36 g |
| Cystine | 0.11 g |
| Phenylalanine | 0.65 g |
| Tyrosine | 0.64 g |
| Valine | 0.74 g |
| Arginine | 0.55 g |
| Histidine | 0.40 g |
| Alanine | 0.62 g |
| Aspartic acid | 0.82 g |
| Glutamic acid | 2.6 g |
| Glycine | 0.27 g |
| Proline | 1.4 g |
| Serine | 0.67 g |
FAQ
How does low-fat Muenster differ from regular Muenster?
Low-fat Muenster has significantly less fat and calories, but retains a similar mild flavor and melting quality, though it may be slightly less rich and creamy.
Is low-fat Muenster a good source of calcium?
Yes, like most cheeses, it is a good source of calcium, which is essential for bone and teeth health.
Can I use low-fat Muenster in recipes that call for regular Muenster?
Absolutely. It works well in most recipes, especially those where melting is key, though you might notice a slight difference in richness.
Nutrient density (calculated · NRF9.3)
Nutrient Rich Foods index: beneficial nutrients (protein, fiber, vitamins, minerals) minus saturated fat, added sugar & sodium, per 100 kcal.
NRF9.3 index — Fulgoni, Keast & Drewnowski, 2009. Computed from USDA nutrients.
Weight-loss friendliness (composite index)
Energy density 2.71 kcal/g · 36% calories from protein · 0.0 g fiber · 3.5 g sugar per 100 g.
Composite of energy density (Rolls et al., 1999), protein & fiber satiety, minus sugar. A calculated heuristic — ranks satiety-per-calorie, not a clinical measure.
Dietary load (calculated from USDA values)
Potential renal acid load. Positive = acid-forming, negative = alkaline-forming.
Sodium-to-potassium ratio: 4.48 (lower is better — aim for ≤ 1)
Sodium:potassium per WHO potassium guidance. Computed from USDA nutrients.