

Game meat, bison, chuck, shoulder clod, separable lean only, raw
Whole food · Lamb, Veal, and Game Products

Photo: Wikipedia
Bison chuck, shoulder clod is a lean, muscular cut from the front shoulder of the animal, prized for its deep, rich, slightly sweet beef-like flavor. Its texture is firm and dense when raw, with very little marbling, making it ideal for slow-cooking methods that break down its connective tissue. Nutritionally, it's a powerhouse of high-quality protein with remarkably low fat and zero carbohydrates.
Calorie split: 75% protein · 0% carbs · 25% fat
↓ Full nutrition💚 Why it's loved
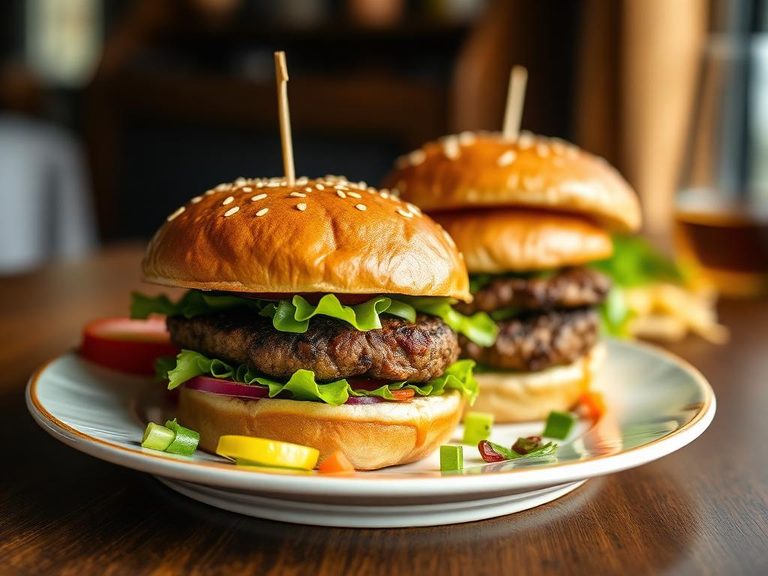
People love bison for its clean, robust flavor that's often described as a richer, slightly sweeter version of beef without being gamey. Its leanness makes it a versatile protein that can be the centerpiece of a hearty stew or ground for a lighter burger.
⚠️ Watch-outs & how to enjoy it better
Due to its very low fat content, bison chuck can become tough and dry if overcooked or prepared with high-heat, quick methods. To counteract this, always cook it low and slow (braising, stewing) or ensure ground bison is not cooked past medium doneness. Those monitoring iron intake should note its high heme iron content.
Key benefits
- Excellent source of complete protein for muscle maintenance.
- Very low in fat, especially saturated fat compared to beef.
- Naturally zero in carbohydrates and sugars.
- Rich in iron and B vitamins like B12 and niacin.
- Often raised without added hormones or routine antibiotics.
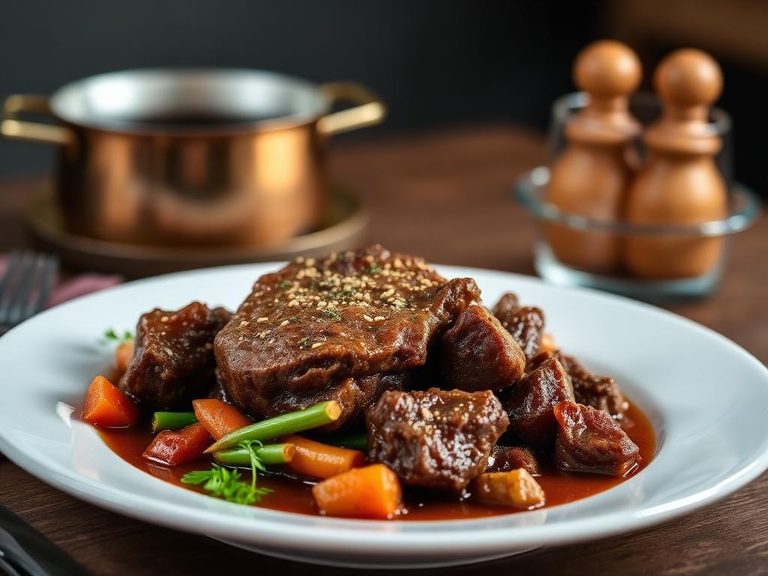
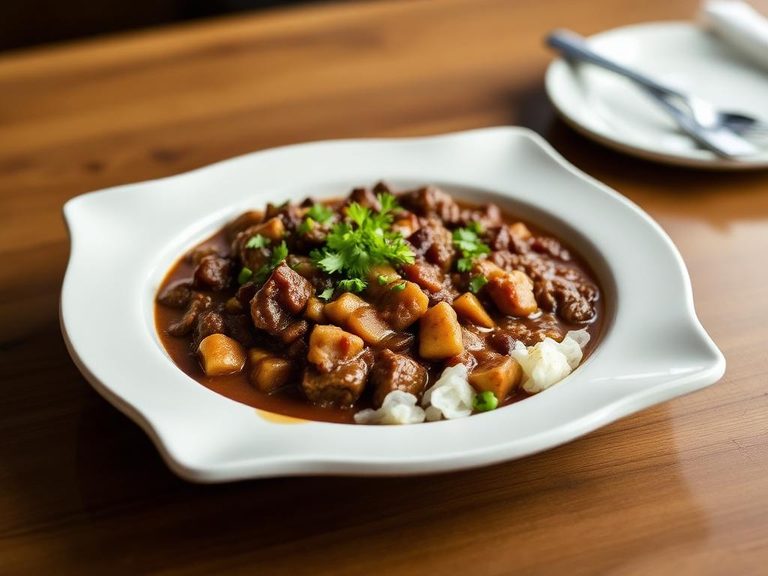
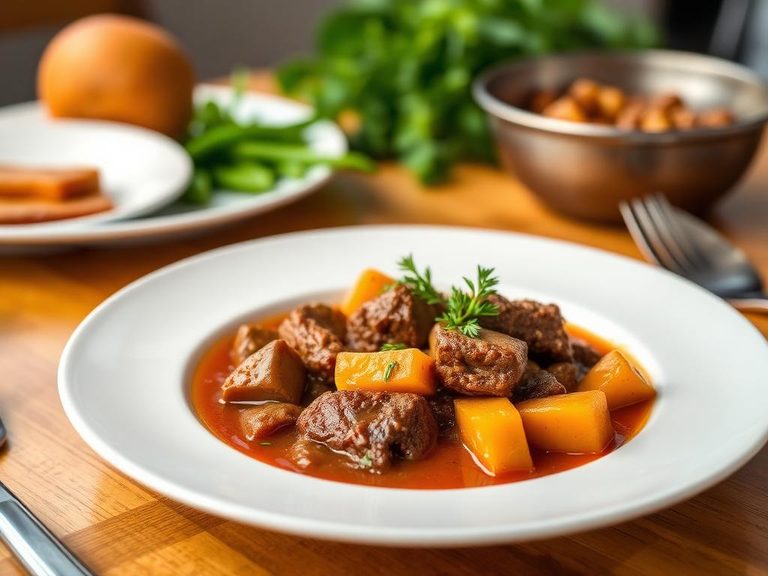
🍽️ Popular dishes
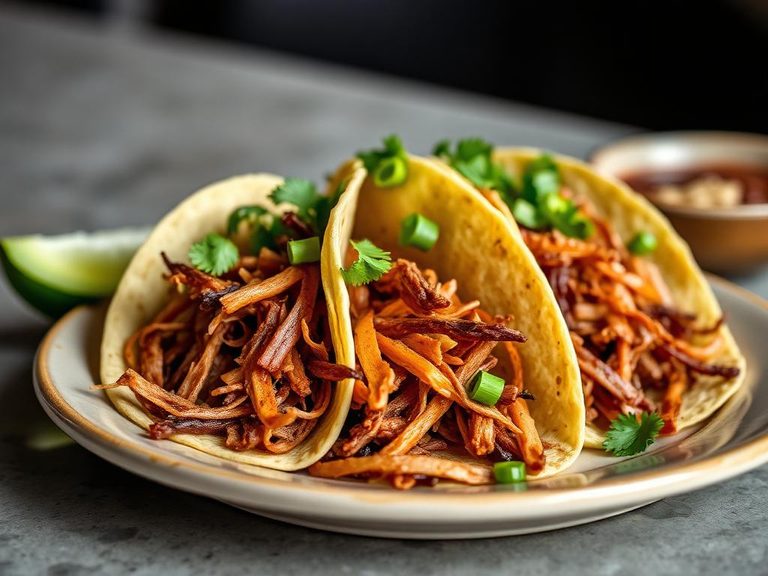
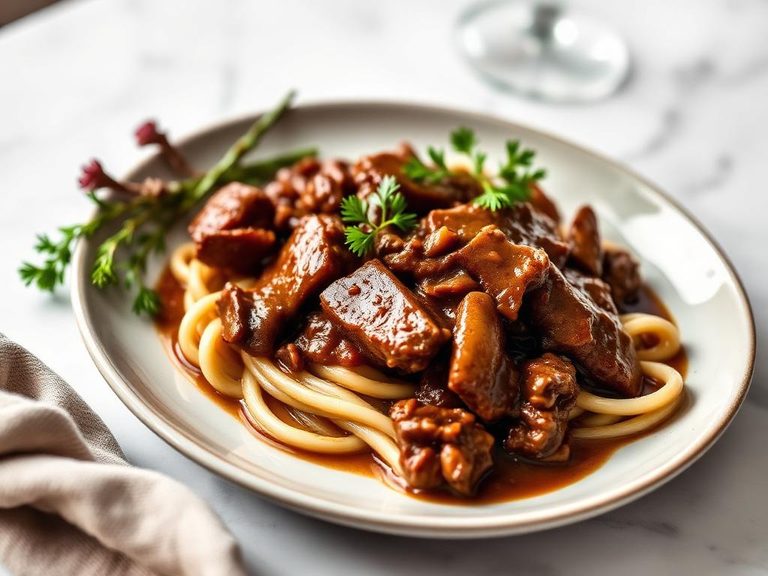
🌍 Where it's eaten
💡 Did you know?
Bison meat's deep red color comes from high levels of myoglobin, a protein that stores oxygen in muscle tissue, which is why it was a critical, nutrient-dense food source for Plains Indigenous peoples.
Full nutrition (USDA data · scales with serving)
| Water | 75.5 g |
| Energy | 119 kcal |
| Energy | 496 kj |
| Protein | 21.1 g |
| Total lipid (fat) | 3.1 g |
| Ash | 0.98 g |
| Carbohydrate, by difference | 0.00 g |
| Fiber, total dietary | 0.00 g |
| Total Sugars | 0.00 g |
| Calcium, Ca | 5.0 mg |
| Iron, Fe | 2.9 mg |
| Magnesium, Mg | 24.0 mg |
| Phosphorus, P | 213 mg |
| Potassium, K | 353 mg |
| Sodium, Na | 62.0 mg |
| Zinc, Zn | 5.3 mg |
| Copper, Cu | 0.20 mg |
| Manganese, Mn | 0.01 mg |
| Selenium, Se | 28.7 ug |
| Vitamin C, total ascorbic acid | 0.00 mg |
| Thiamin | 0.23 mg |
| Riboflavin | 0.35 mg |
| Niacin | 4.4 mg |
| Pantothenic acid | 0.72 mg |
| Vitamin B-6 | 0.47 mg |
| Folate, total | 13.0 ug |
| Folic acid | 0.00 ug |
| Folate, food | 13.0 ug |
| Folate, DFE | 13.0 ug |
| Vitamin B-12 | 2.5 ug |
| Vitamin A, RAE | 0.00 ug |
| Retinol | 0.00 ug |
| Carotene, beta | 0.00 ug |
| Carotene, alpha | 0.00 ug |
| Cryptoxanthin, beta | 0.00 ug |
| Vitamin A, IU | 0.00 iu |
| Lycopene | 0.00 ug |
| Lutein + zeaxanthin | 0.00 ug |
| Vitamin E (alpha-tocopherol) | 0.16 mg |
| Alcohol, ethyl | 0.00 g |
| Caffeine | 0.00 mg |
| Theobromine | 0.00 mg |
Fat & fatty acid profile (per 100g)
| Fatty acids, total saturated | 1.3 g |
| SFA 8:0 | 0.00 g |
| SFA 10:0 | 0.00 g |
| SFA 12:0 | 0.00 g |
| SFA 14:0 | 0.06 g |
| SFA 15:0 | 0.02 g |
| SFA 16:0 | 0.57 g |
| SFA 17:0 | 0.05 g |
| SFA 18:0 | 0.65 g |
| SFA 20:0 | 0.01 g |
| SFA 22:0 | 0.00 g |
| Fatty acids, total monounsaturated | 1.2 g |
| MUFA 14:1 | 0.01 g |
| MUFA 15:1 | 0.00 g |
| MUFA 16:1 | 0.06 g |
| MUFA 17:1 | 0.02 g |
| MUFA 18:1 | 1.1 g |
| MUFA 20:1 | 0.01 g |
| Fatty acids, total polyunsaturated | 0.15 g |
| PUFA 18:2 | 0.11 g |
| PUFA 18:3 | 0.02 g |
| PUFA 18:3 n-6 c,c,c | 0.00 g |
| PUFA 20:2 n-6 c,c | 0.00 g |
| PUFA 20:3 | 0.00 g |
| PUFA 20:4 | 0.02 g |
| Cholesterol | 64.0 mg |
Amino acid profile (per 100g)
| Tryptophan | 0.16 g |
| Threonine | 0.96 g |
| Isoleucine | 1.0 g |
| Leucine | 1.8 g |
| Lysine | 2.0 g |
| Methionine | 0.57 g |
| Cystine | 0.25 g |
| Phenylalanine | 0.90 g |
| Tyrosine | 0.72 g |
| Valine | 1.1 g |
| Arginine | 1.4 g |
| Histidine | 0.77 g |
| Alanine | 1.4 g |
| Aspartic acid | 2.1 g |
| Glutamic acid | 3.4 g |
| Glycine | 1.4 g |
| Proline | 1.1 g |
| Serine | 0.88 g |
| Hydroxyproline | 0.26 g |
FAQ
How is bison different from beef?
Bison is leaner, with a slightly sweeter and richer flavor. It has less marbling and fat, so it cooks faster and requires lower cooking temperatures to stay tender.
Can I cook bison chuck like beef chuck?
Yes, but with adjustments. Use lower heat, shorter cooking times, and more liquid (braising) to prevent it from drying out due to its low fat content.
Is bison meat healthier than beef?
Generally, yes. It typically has fewer calories, less total fat, and less saturated fat than comparable beef cuts, while providing similar or higher levels of protein, iron, and B vitamins.
Nutrient density (calculated · NRF9.3)
Nutrient Rich Foods index: beneficial nutrients (protein, fiber, vitamins, minerals) minus saturated fat, added sugar & sodium, per 100 kcal.
NRF9.3 index — Fulgoni, Keast & Drewnowski, 2009. Computed from USDA nutrients.
Weight-loss friendliness (composite index)
Energy density 1.19 kcal/g · 71% calories from protein · 0.0 g fiber · 0.0 g sugar per 100 g.
Composite of energy density (Rolls et al., 1999), protein & fiber satiety, minus sugar. A calculated heuristic — ranks satiety-per-calorie, not a clinical measure.
Dietary load (calculated from USDA values)
Potential renal acid load. Positive = acid-forming, negative = alkaline-forming.
Sodium-to-potassium ratio: 0.18 (lower is better — aim for ≤ 1)
Sodium:potassium per WHO potassium guidance. Computed from USDA nutrients.