

Ostrich, inside strip, raw
Whole food · Poultry Products

Photo: Wikipedia
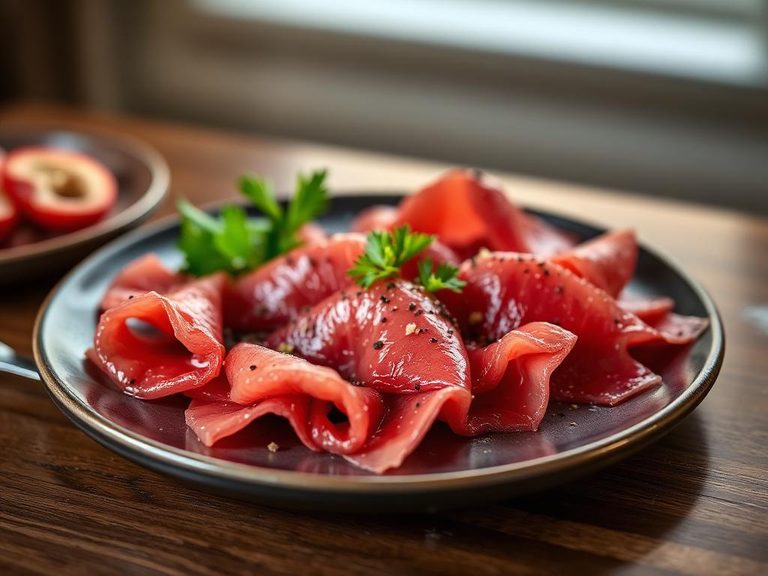
Ostrich inside strip is a lean, deep-red cut from the bird's inner thigh, prized for its remarkably beef-like texture and mild, clean flavor. Nutritionally, it's a powerhouse, delivering an exceptional amount of protein (23.69g) with minimal fat (2.87g) and zero carbohydrates per 100g, making it a staple for high-protein, low-fat diets.
Calorie split: 79% protein · 0% carbs · 21% fat
↓ Full nutrition💚 Why it's loved
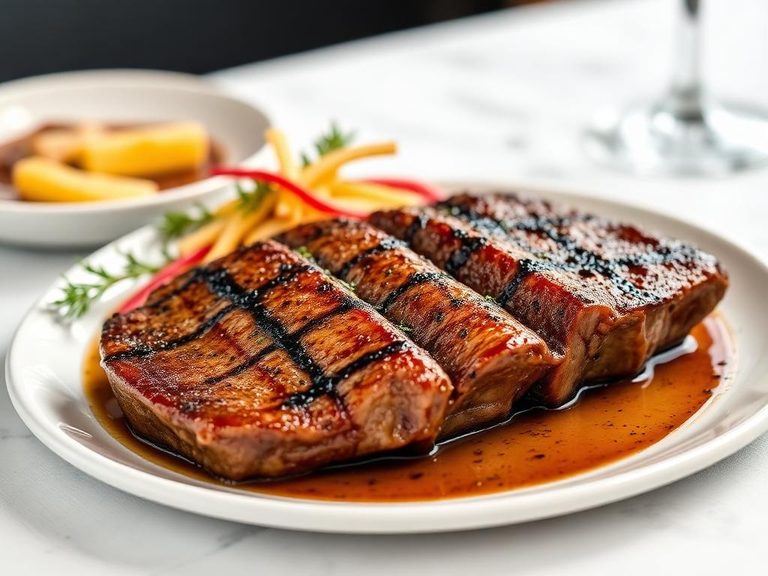
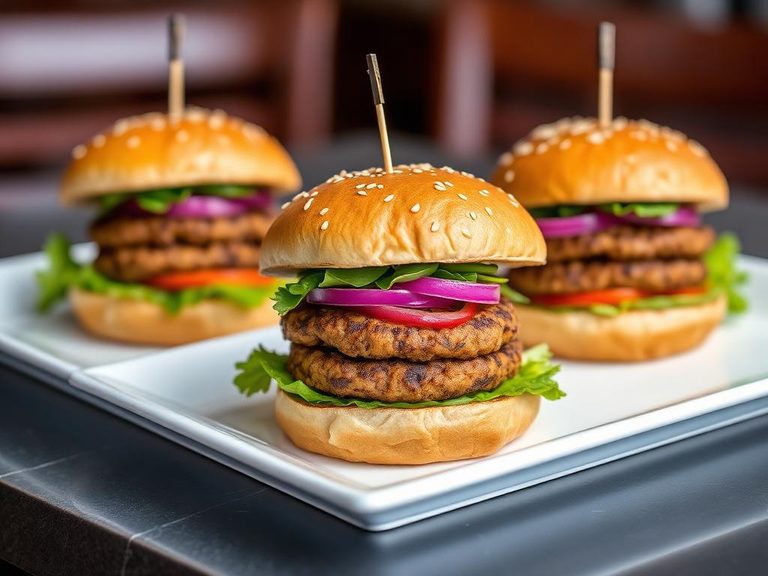
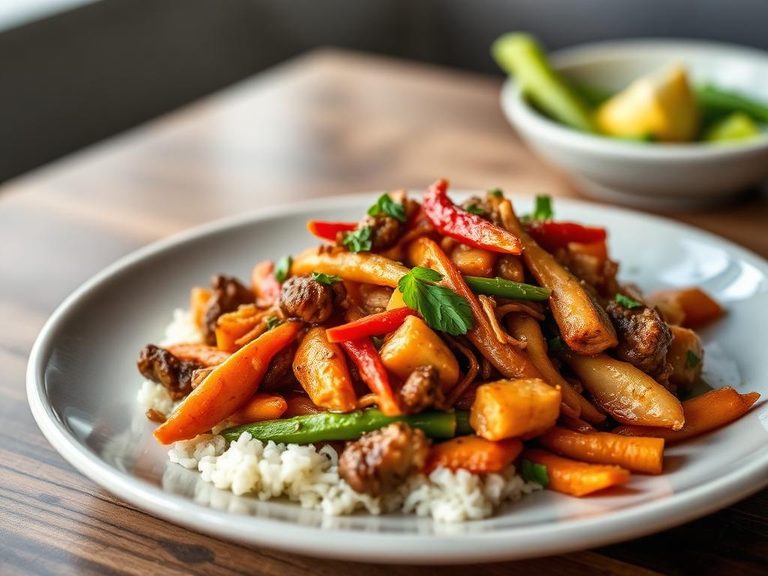
People love ostrich for its uncanny similarity to premium lean beef in taste and mouthfeel, but with a fraction of the fat. Its versatility allows it to be grilled, seared, or stir-fried quickly, making it a favorite for healthy, restaurant-quality meals at home.
⚠️ Watch-outs & how to enjoy it better
Due to its very low fat content, ostrich can become dry and tough if overcooked, which is a common pitfall for those accustomed to fattier meats. To counteract this, cook it quickly over high heat (to medium-rare or medium) and let it rest before slicing. It is also a red meat, so individuals monitoring purine intake for conditions like gout should consume it in moderation.
Key benefits
- Extremely high in lean protein for muscle maintenance and satiety
- Very low in fat and calories, supporting weight management
- Rich in iron and B vitamins, particularly B12 and niacin
- Naturally free of carbohydrates and sugars, suitable for ketogenic diets
- A sustainable red meat alternative with a smaller environmental footprint than beef
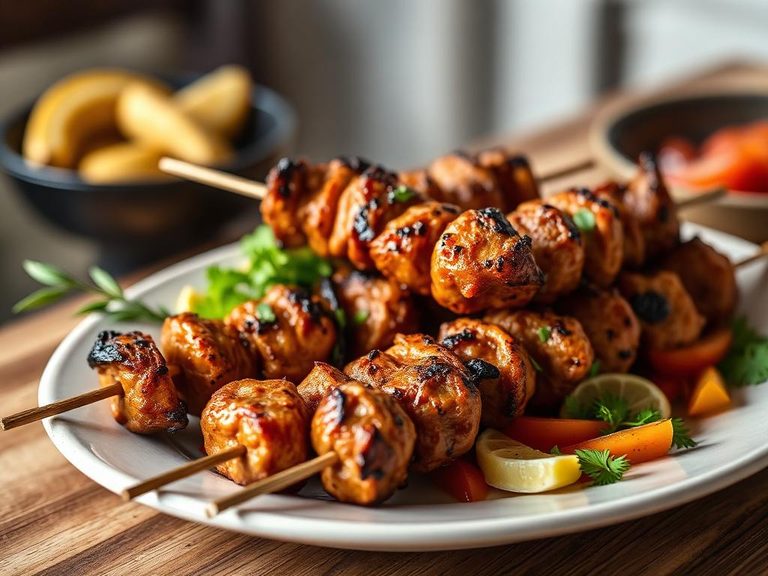
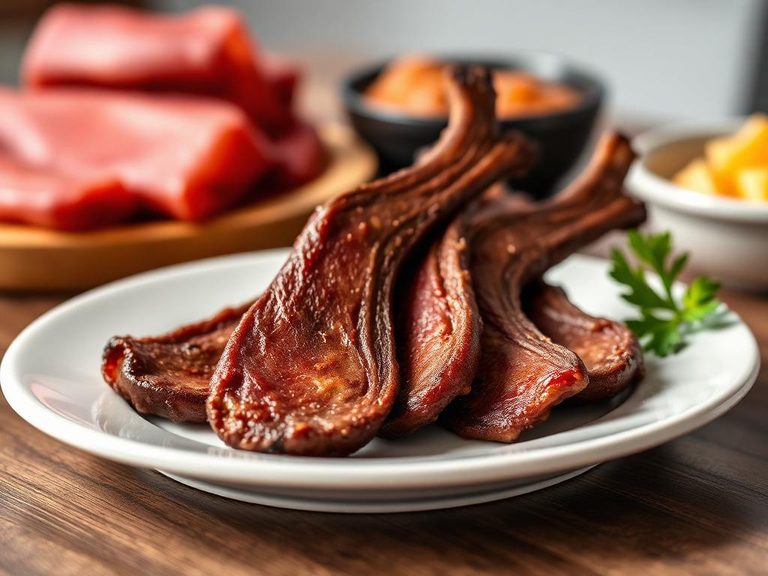
🍽️ Popular dishes
🌍 Where it's eaten
💡 Did you know?
Despite being the world's largest living bird, an ostrich's inside strip is remarkably tender because the muscle is rarely used for sustained movement, unlike the tougher leg muscles.
Full nutrition (USDA data · scales with serving)
| Water | 74.2 g |
| Energy | 127 kcal |
| Energy | 532 kj |
| Protein | 23.7 g |
| Total lipid (fat) | 2.9 g |
| Ash | 1.2 g |
| Carbohydrate, by difference | 0.00 g |
| Fiber, total dietary | 0.00 g |
| Total Sugars | 0.00 g |
| Calcium, Ca | 5.0 mg |
| Iron, Fe | 4.2 mg |
| Magnesium, Mg | 23.0 mg |
| Phosphorus, P | 226 mg |
| Potassium, K | 330 mg |
| Sodium, Na | 76.0 mg |
| Zinc, Zn | 4.0 mg |
| Copper, Cu | 0.14 mg |
| Manganese, Mn | 0.02 mg |
| Selenium, Se | 37.5 ug |
| Vitamin C, total ascorbic acid | 0.00 mg |
| Thiamin | 0.21 mg |
| Riboflavin | 0.31 mg |
| Niacin | 5.1 mg |
| Pantothenic acid | 1.3 mg |
| Vitamin B-6 | 0.56 mg |
| Folate, total | 9.0 ug |
| Folic acid | 0.00 ug |
| Folate, food | 9.0 ug |
| Folate, DFE | 9.0 ug |
| Vitamin B-12 | 5.4 ug |
| Vitamin A, RAE | 0.00 ug |
| Retinol | 0.00 ug |
| Carotene, beta | 0.00 ug |
| Carotene, alpha | 0.00 ug |
| Cryptoxanthin, beta | 0.00 ug |
| Vitamin A, IU | 0.00 iu |
| Lycopene | 0.00 ug |
| Lutein + zeaxanthin | 0.00 ug |
| Vitamin E (alpha-tocopherol) | 0.21 mg |
| Alcohol, ethyl | 0.00 g |
| Caffeine | 0.00 mg |
| Theobromine | 0.00 mg |
Fat & fatty acid profile (per 100g)
| Fatty acids, total saturated | 0.92 g |
| SFA 12:0 | 0.00 g |
| SFA 14:0 | 0.03 g |
| SFA 15:0 | 0.01 g |
| SFA 16:0 | 0.71 g |
| SFA 17:0 | 0.01 g |
| SFA 18:0 | 0.16 g |
| SFA 22:0 | 0.00 g |
| Fatty acids, total monounsaturated | 1.2 g |
| MUFA 14:1 | 0.01 g |
| MUFA 16:1 | 0.27 g |
| MUFA 17:1 | 0.01 g |
| MUFA 18:1 | 0.88 g |
| MUFA 20:1 | 0.01 g |
| Fatty acids, total polyunsaturated | 0.59 g |
| PUFA 18:2 | 0.46 g |
| PUFA 18:3 | 0.05 g |
| PUFA 20:2 n-6 c,c | 0.00 g |
| PUFA 20:4 | 0.07 g |
| PUFA 20:5 n-3 (EPA) | 0.01 g |
| PUFA 22:6 n-3 (DHA) | 0.00 g |
| Cholesterol | 73.0 mg |
Amino acid profile (per 100g)
| Tryptophan | 0.21 g |
| Threonine | 1.0 g |
| Isoleucine | 1.1 g |
| Leucine | 1.9 g |
| Lysine | 2.1 g |
| Methionine | 0.66 g |
| Cystine | 0.24 g |
| Phenylalanine | 0.98 g |
| Tyrosine | 0.77 g |
| Valine | 1.2 g |
| Arginine | 1.6 g |
| Histidine | 0.59 g |
| Alanine | 1.5 g |
| Aspartic acid | 2.2 g |
| Glutamic acid | 3.6 g |
| Glycine | 1.6 g |
| Proline | 1.2 g |
| Serine | 0.95 g |
| Hydroxyproline | 0.42 g |
FAQ
How does ostrich meat taste compared to beef?
Ostrich has a very similar taste and texture to lean beef, like sirloin or tenderloin, but is often described as slightly sweeter and cleaner with a more delicate flavor.
Is ostrich meat safe to eat rare?
Yes, when handled properly, ostrich can be enjoyed rare to medium-rare, similar to beef. Its deep red color is natural and does not indicate it needs to be cooked well-done.
Why is ostrich meat so red?
The deep red color comes from high levels of myoglobin, a protein that stores oxygen in muscles. This is normal for ostrich and contributes to its iron-rich nutritional profile.
Nutrient density (calculated · NRF9.3)
Nutrient Rich Foods index: beneficial nutrients (protein, fiber, vitamins, minerals) minus saturated fat, added sugar & sodium, per 100 kcal.
NRF9.3 index — Fulgoni, Keast & Drewnowski, 2009. Computed from USDA nutrients.
Weight-loss friendliness (composite index)
Energy density 1.27 kcal/g · 75% calories from protein · 0.0 g fiber · 0.0 g sugar per 100 g.
Composite of energy density (Rolls et al., 1999), protein & fiber satiety, minus sugar. A calculated heuristic — ranks satiety-per-calorie, not a clinical measure.
Dietary load (calculated from USDA values)
Potential renal acid load. Positive = acid-forming, negative = alkaline-forming.
Sodium-to-potassium ratio: 0.23 (lower is better — aim for ≤ 1)
Sodium:potassium per WHO potassium guidance. Computed from USDA nutrients.