

Peas and carrots, fresh, cooked, fat added
Common food
This is the classic, comforting side dish of tender, sweet carrots and earthy, vibrant green peas, lightly sautéed or steamed with a touch of fat like butter or oil. The texture is a pleasant mix of soft, yielding carrot coins and the gentle pop of peas. Nutritionally, it's a low-calorie powerhouse, delivering a solid 4.4 grams of fiber per 100g to aid digestion.
Calorie split: 14% protein · 55% carbs · 30% fat
↓ Full nutrition💚 Why it's loved
People love it for its nostalgic, homestyle comfort and the perfect balance of sweet and savory flavors. It's incredibly versatile, serving as a simple side, a colorful addition to stews, or a base for casseroles.
⚠️ Watch-outs & how to enjoy it better
The added fat (3.03g per 100g) can increase calorie density, and some commercial versions may be high in sodium. To counteract this, use minimal healthy fats like olive oil, season with herbs instead of salt, and pair with a lean protein like chicken or fish to balance the meal.
Key benefits
- Excellent source of dietary fiber for gut health.
- Provides plant-based protein (3.22g per 100g).
- Rich in beta-carotene (vitamin A) from carrots.
- Contains antioxidants like lutein from peas.
- Low in calories (89 kcal per 100g).
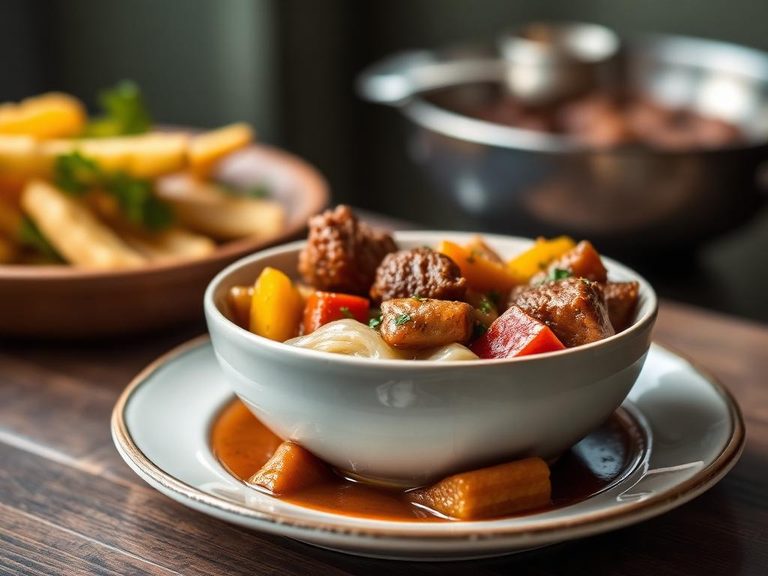
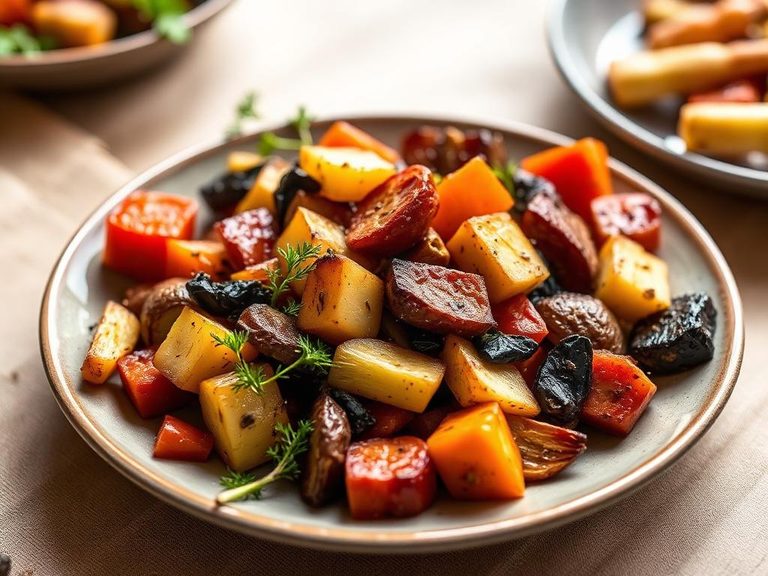
🍽️ Popular dishes
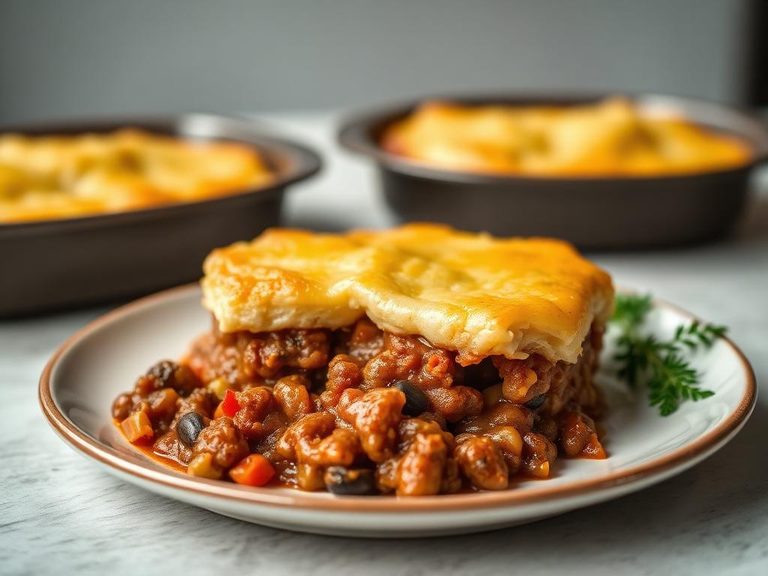
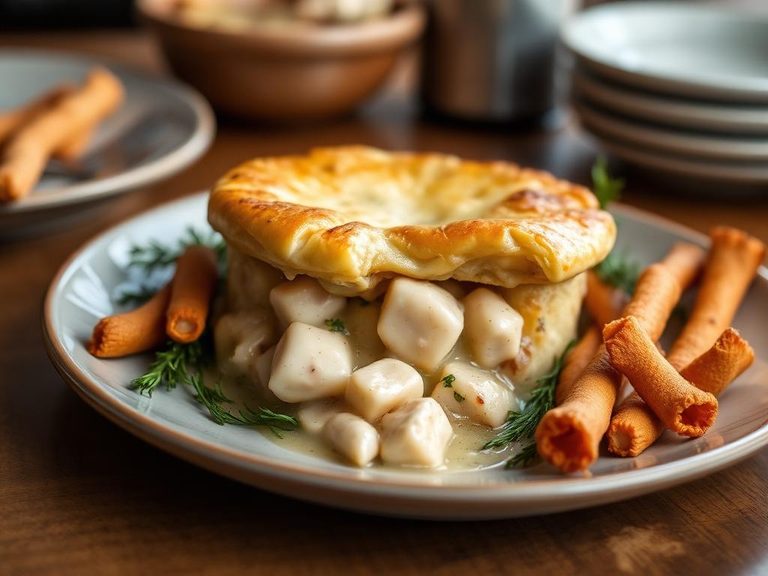
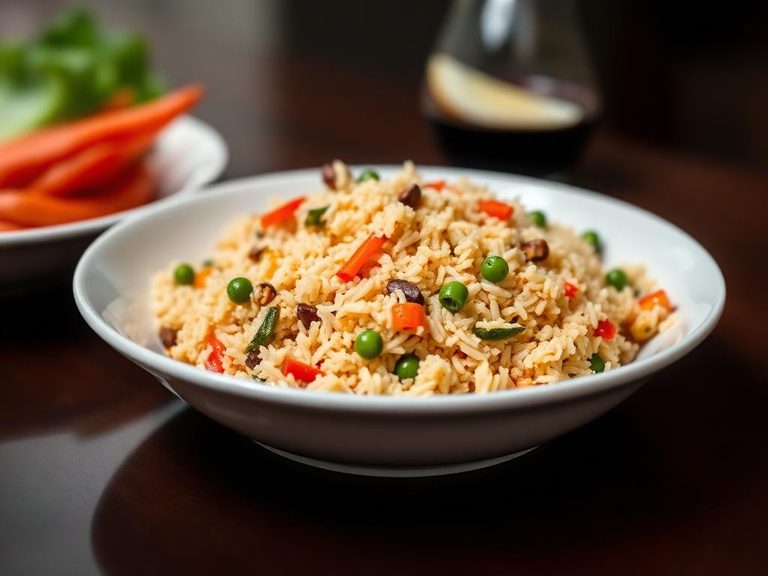
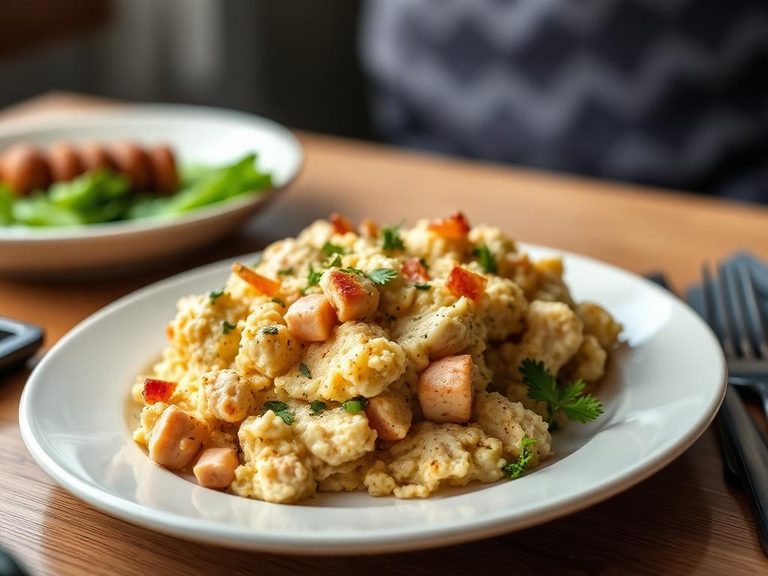
🌍 Where it's eaten
💡 Did you know?
The combination became a ubiquitous frozen vegetable mix in the United States largely due to the innovation of Clarence Birdseye, who pioneered flash-freezing technology in the 1920s.
Full nutrition (USDA data · scales with serving)
| Water | 80.2 g |
| Energy | 89.0 kcal |
| Protein | 3.2 g |
| Total lipid (fat) | 3.0 g |
| Carbohydrate, by difference | 12.5 g |
| Fiber, total dietary | 4.4 g |
| Total Sugars | 5.3 g |
| Calcium, Ca | 28.0 mg |
| Iron, Fe | 0.82 mg |
| Magnesium, Mg | 23.0 mg |
| Phosphorus, P | 75.0 mg |
| Potassium, K | 265 mg |
| Sodium, Na | 172 mg |
| Zinc, Zn | 0.75 mg |
| Copper, Cu | 0.12 mg |
| Selenium, Se | 0.90 ug |
| Vitamin C, total ascorbic acid | 19.7 mg |
| Thiamin | 0.15 mg |
| Riboflavin | 0.11 mg |
| Niacin | 1.7 mg |
| Vitamin B-6 | 0.16 mg |
| Folate, total | 44.0 ug |
| Folic acid | 0.00 ug |
| Folate, food | 44.0 ug |
| Folate, DFE | 44.0 ug |
| Choline, total | 19.0 mg |
| Vitamin B-12 | 0.00 ug |
| Vitamin B-12, added | 0.00 ug |
| Vitamin A, RAE | 430 ug |
| Retinol | 11.0 ug |
| Carotene, beta | 4189 ug |
| Carotene, alpha | 1676 ug |
| Cryptoxanthin, beta | 0.00 ug |
| Lycopene | 0.00 ug |
| Lutein + zeaxanthin | 1309 ug |
| Vitamin E (alpha-tocopherol) | 0.80 mg |
| Vitamin E, added | 0.00 mg |
| Vitamin D (D2 + D3) | 0.00 ug |
| Vitamin K (phylloquinone) | 21.3 ug |
| Alcohol, ethyl | 0.00 g |
| Caffeine | 0.00 mg |
| Theobromine | 0.00 mg |
Fat & fatty acid profile (per 100g)
| Fatty acids, total saturated | 0.75 g |
| SFA 4:0 | 0.02 g |
| SFA 6:0 | 0.01 g |
| SFA 8:0 | 0.01 g |
| SFA 10:0 | 0.02 g |
| SFA 12:0 | 0.02 g |
| SFA 14:0 | 0.07 g |
| SFA 16:0 | 0.43 g |
| SFA 18:0 | 0.15 g |
| Fatty acids, total monounsaturated | 0.96 g |
| MUFA 16:1 | 0.02 g |
| MUFA 18:1 | 0.93 g |
| MUFA 20:1 | 0.01 g |
| MUFA 22:1 | 0.00 g |
| Fatty acids, total polyunsaturated | 0.91 g |
| PUFA 18:2 | 0.80 g |
| PUFA 18:3 | 0.10 g |
| PUFA 18:4 | 0.00 g |
| PUFA 20:4 | 0.00 g |
| PUFA 20:5 n-3 (EPA) | 0.00 g |
| PUFA 22:5 n-3 (DPA) | 0.00 g |
| PUFA 22:6 n-3 (DHA) | 0.00 g |
| Cholesterol | 2.0 mg |
Amino acid profile (per 100g)
Estimated from Peas and carrots, frozen, cooked, boiled, drained, without salt — USDA does not publish this profile for Peas and carrots.
| Tryptophan | 0.02 g |
| Threonine | 0.16 g |
| Isoleucine | 0.12 g |
| Leucine | 0.18 g |
| Lysine | 0.18 g |
| Methionine | 0.04 g |
| Cystine | 0.04 g |
| Phenylalanine | 0.11 g |
| Tyrosine | 0.07 g |
| Valine | 0.13 g |
| Arginine | 0.23 g |
| Histidine | 0.06 g |
| Alanine | 0.15 g |
| Aspartic acid | 0.29 g |
| Glutamic acid | 0.47 g |
| Glycine | 0.10 g |
| Proline | 0.10 g |
| Serine | 0.10 g |
FAQ
Are peas and carrots a good source of protein?
Yes, for a vegetable side dish. At 3.22g of protein per 100g, they contribute a meaningful amount, especially when combined with other protein sources in a meal.
How does cooking affect the nutrition?
Cooking, especially steaming, can make some nutrients like beta-carotene more bioavailable. However, boiling can cause water-soluble vitamins (like vitamin C) to leach out. Using minimal water and cooking time helps retain nutrients.
Is the sugar content high?
The 5.25g of sugar per 100g comes naturally from the carrots and peas. It's accompanied by 4.4g of fiber, which slows sugar absorption, making it a much healthier choice than added sugars.
Nutrient density (calculated · NRF9.3)
Nutrient Rich Foods index: beneficial nutrients (protein, fiber, vitamins, minerals) minus saturated fat, added sugar & sodium, per 100 kcal.
NRF9.3 index — Fulgoni, Keast & Drewnowski, 2009. Computed from USDA nutrients.
Weight-loss friendliness (composite index)
Energy density 0.89 kcal/g · 14% calories from protein · 4.4 g fiber · 5.3 g sugar per 100 g.
Composite of energy density (Rolls et al., 1999), protein & fiber satiety, minus sugar. A calculated heuristic — ranks satiety-per-calorie, not a clinical measure.
Dietary load (calculated from USDA values)
Potential renal acid load. Positive = acid-forming, negative = alkaline-forming.
Sodium-to-potassium ratio: 0.65 (lower is better — aim for ≤ 1)
Sodium:potassium per WHO potassium guidance. Computed from USDA nutrients.