

Peas and carrots, frozen, cooked, no added fat
Common food
Frozen peas and carrots are a classic, time-saving vegetable medley. They offer a pleasant contrast: the sweet, starchy pop of peas against the earthy, tender bite of carrots. Nutritionally, they are a low-calorie, high-fiber source of vitamins A and C.
Calorie split: 20% protein · 74% carbs · 6% fat
↓ Full nutrition💚 Why it's loved
People love this duo for its effortless convenience and nostalgic comfort. The sweet-savory flavor profile is universally appealing, making it a reliable side dish or recipe booster.
⚠️ Watch-outs & how to enjoy it better
The primary concern is the potential for added sodium in some frozen brands, which can affect blood pressure. To counteract this, choose 'no salt added' varieties or rinse the vegetables before cooking. Their high fiber content, while beneficial, can cause digestive discomfort if introduced too quickly; start with smaller portions.
Key benefits
- Excellent source of dietary fiber (3.8g per 100g)
- Rich in Vitamin A from carrots, supporting vision
- Provides plant-based protein (2.97g per 100g)
- Very low in fat and calories
- Convenient, pre-cut, and available year-round
🍽️ Popular dishes
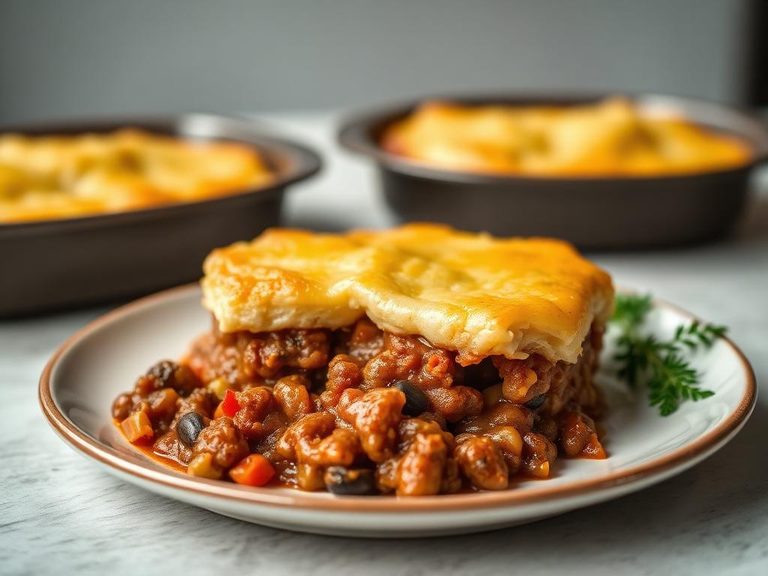
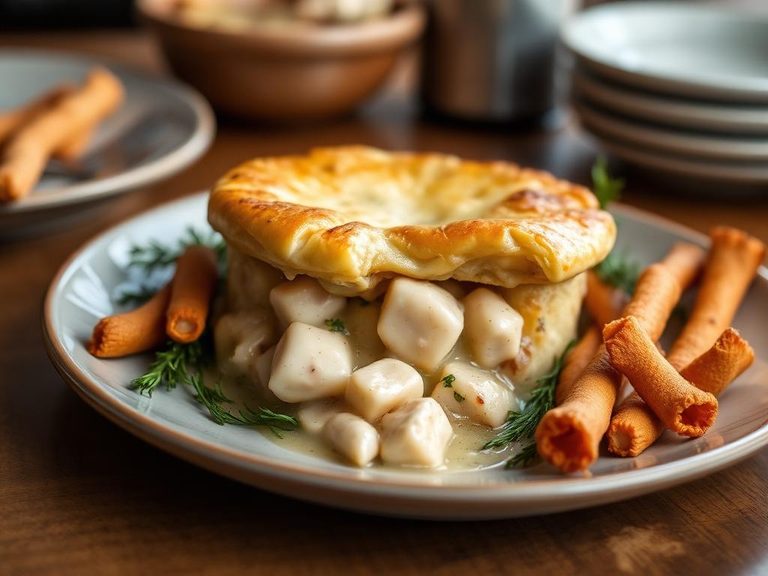
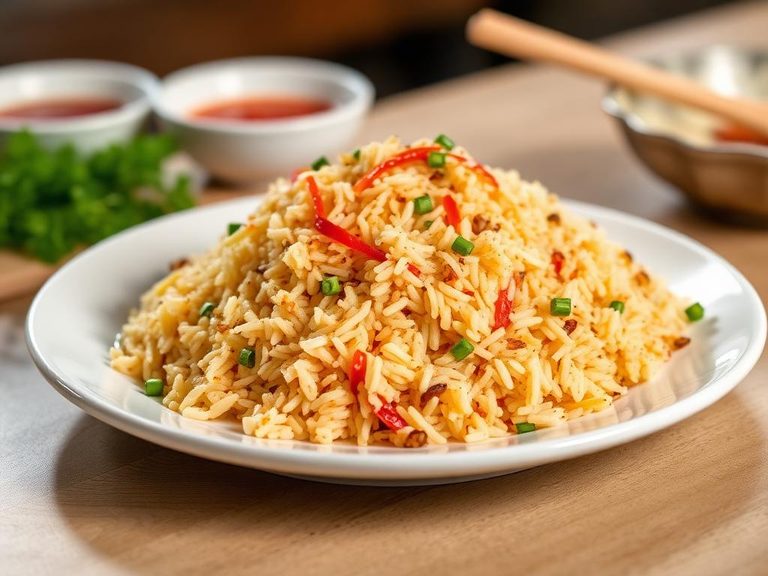
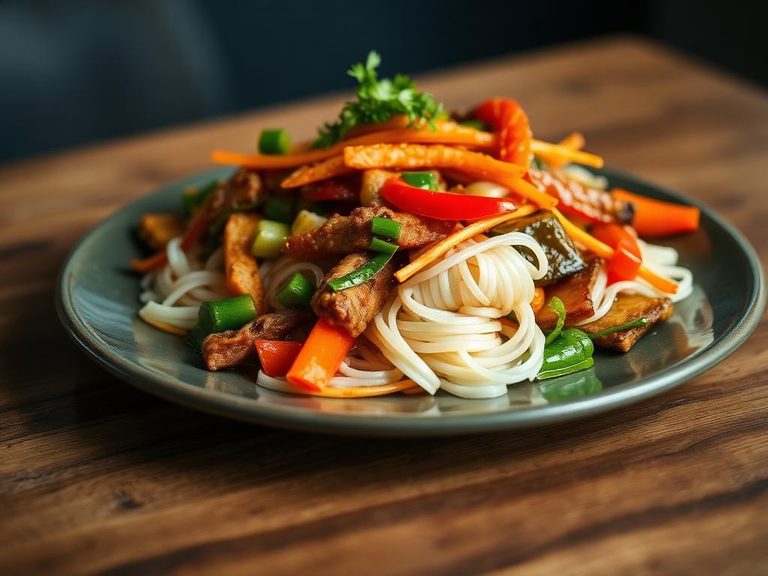
🌍 Where it's eaten
💡 Did you know?
The practice of freezing peas was pioneered by Clarence Birdseye in the 1920s, and his first successful commercial test involved freezing peas and carrots.
Full nutrition (USDA data · scales with serving)
| Water | 84.6 g |
| Energy | 58.0 kcal |
| Protein | 3.0 g |
| Total lipid (fat) | 0.37 g |
| Carbohydrate, by difference | 11.1 g |
| Fiber, total dietary | 3.8 g |
| Total Sugars | 4.3 g |
| Calcium, Ca | 29.0 mg |
| Iron, Fe | 0.97 mg |
| Magnesium, Mg | 16.0 mg |
| Phosphorus, P | 54.0 mg |
| Potassium, K | 160 mg |
| Sodium, Na | 185 mg |
| Zinc, Zn | 0.47 mg |
| Copper, Cu | 0.09 mg |
| Selenium, Se | 0.80 ug |
| Vitamin C, total ascorbic acid | 6.0 mg |
| Thiamin | 0.16 mg |
| Riboflavin | 0.07 mg |
| Niacin | 0.97 mg |
| Vitamin B-6 | 0.10 mg |
| Folate, total | 33.0 ug |
| Folic acid | 0.00 ug |
| Folate, food | 33.0 ug |
| Folate, DFE | 33.0 ug |
| Choline, total | 18.0 mg |
| Vitamin B-12 | 0.00 ug |
| Vitamin B-12, added | 0.00 ug |
| Vitamin A, RAE | 474 ug |
| Retinol | 0.00 ug |
| Carotene, beta | 4710 ug |
| Carotene, alpha | 1862 ug |
| Cryptoxanthin, beta | 0.00 ug |
| Lycopene | 0.00 ug |
| Lutein + zeaxanthin | 1533 ug |
| Vitamin E (alpha-tocopherol) | 0.36 mg |
| Vitamin E, added | 0.00 mg |
| Vitamin D (D2 + D3) | 0.00 ug |
| Vitamin K (phylloquinone) | 19.4 ug |
| Alcohol, ethyl | 0.00 g |
| Caffeine | 0.00 mg |
| Theobromine | 0.00 mg |
Fat & fatty acid profile (per 100g)
| Fatty acids, total saturated | 0.02 g |
| SFA 4:0 | 0.00 g |
| SFA 6:0 | 0.00 g |
| SFA 8:0 | 0.00 g |
| SFA 10:0 | 0.00 g |
| SFA 12:0 | 0.00 g |
| SFA 14:0 | 0.00 g |
| SFA 16:0 | 0.02 g |
| SFA 18:0 | 0.00 g |
| Fatty acids, total monounsaturated | 0.01 g |
| MUFA 16:1 | 0.00 g |
| MUFA 18:1 | 0.01 g |
| MUFA 20:1 | 0.00 g |
| MUFA 22:1 | 0.00 g |
| Fatty acids, total polyunsaturated | 0.15 g |
| PUFA 18:2 | 0.13 g |
| PUFA 18:3 | 0.01 g |
| PUFA 18:4 | 0.00 g |
| PUFA 20:4 | 0.00 g |
| PUFA 20:5 n-3 (EPA) | 0.00 g |
| PUFA 22:5 n-3 (DPA) | 0.00 g |
| PUFA 22:6 n-3 (DHA) | 0.00 g |
| Cholesterol | 0.00 mg |
Amino acid profile (per 100g)
Estimated from Peas and carrots, frozen, cooked, boiled, drained, without salt — USDA does not publish this profile for Peas and carrots.
| Tryptophan | 0.02 g |
| Threonine | 0.16 g |
| Isoleucine | 0.12 g |
| Leucine | 0.18 g |
| Lysine | 0.18 g |
| Methionine | 0.04 g |
| Cystine | 0.04 g |
| Phenylalanine | 0.11 g |
| Tyrosine | 0.07 g |
| Valine | 0.13 g |
| Arginine | 0.23 g |
| Histidine | 0.06 g |
| Alanine | 0.15 g |
| Aspartic acid | 0.29 g |
| Glutamic acid | 0.47 g |
| Glycine | 0.10 g |
| Proline | 0.10 g |
| Serine | 0.10 g |
FAQ
Are frozen peas and carrots as nutritious as fresh?
Often, yes. They are typically flash-frozen at peak ripeness, which can lock in more nutrients than fresh produce that travels long distances. The nutritional difference is minimal.
Do I need to thaw them before cooking?
No. For most applications like stir-fries, soups, or boiling, you can add them directly from frozen. This helps retain their texture and nutrients.
Why are my cooked peas and carrots mushy?
Overcooking is the common culprit. Simmer or steam them just until tender-crisp, usually 3-5 minutes from frozen. Prolonged boiling breaks down their cell structure.
Nutrient density (calculated · NRF9.3)
Nutrient Rich Foods index: beneficial nutrients (protein, fiber, vitamins, minerals) minus saturated fat, added sugar & sodium, per 100 kcal.
NRF9.3 index — Fulgoni, Keast & Drewnowski, 2009. Computed from USDA nutrients.
Weight-loss friendliness (composite index)
Energy density 0.58 kcal/g · 20% calories from protein · 3.8 g fiber · 4.3 g sugar per 100 g.
Composite of energy density (Rolls et al., 1999), protein & fiber satiety, minus sugar. A calculated heuristic — ranks satiety-per-calorie, not a clinical measure.
Dietary load (calculated from USDA values)
Potential renal acid load. Positive = acid-forming, negative = alkaline-forming.
Sodium-to-potassium ratio: 1.16 (lower is better — aim for ≤ 1)
Sodium:potassium per WHO potassium guidance. Computed from USDA nutrients.