

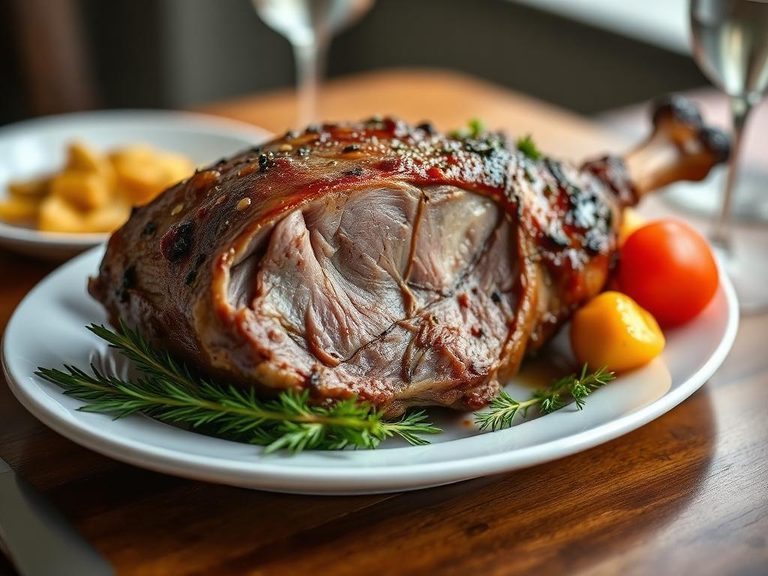
Mutton, cooked, roasted (Navajo)
Whole food · American Indian/Alaska Native Foods

Photo: Wikipedia
Roasted Navajo mutton is a lean, deeply savory meat prized for its firm, satisfying texture and rich, gamey flavor. This preparation method yields a protein powerhouse with virtually no carbohydrates, making it a staple for high-protein, low-carb diets. Its nutritional profile is dominated by high-quality protein and a moderate amount of fat, offering sustained energy without blood sugar spikes.
Calorie split: 57% protein · 0% carbs · 43% fat
↓ Full nutrition💚 Why it's loved
People cherish it for its robust, distinctive flavor that stands up to bold seasonings and slow-cooking methods. It's a cultural cornerstone in Navajo cuisine, representing tradition, community, and the deep connection to the land.
⚠️ Watch-outs & how to enjoy it better
The strong, gamey taste can be polarizing for those accustomed to milder meats like chicken or pork. To balance the flavor, marinate with acidic components like citrus or vinegar, or pair with cooling sides like cucumber salads. Ensure thorough cooking to avoid toughness.
Key benefits
- Excellent source of complete protein for muscle maintenance
- Virtually zero carbohydrates, ideal for ketogenic diets
- Rich in iron and B vitamins, especially B12
- Provides conjugated linoleic acid (CLA), a beneficial fatty acid
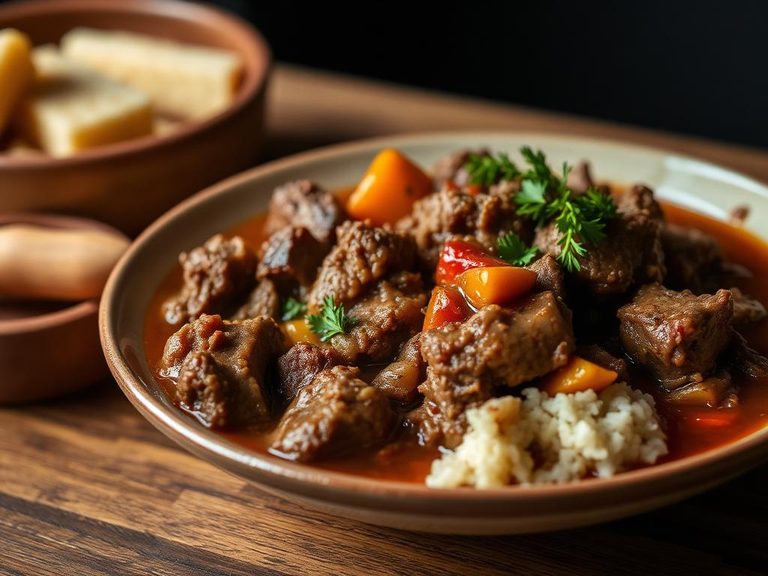
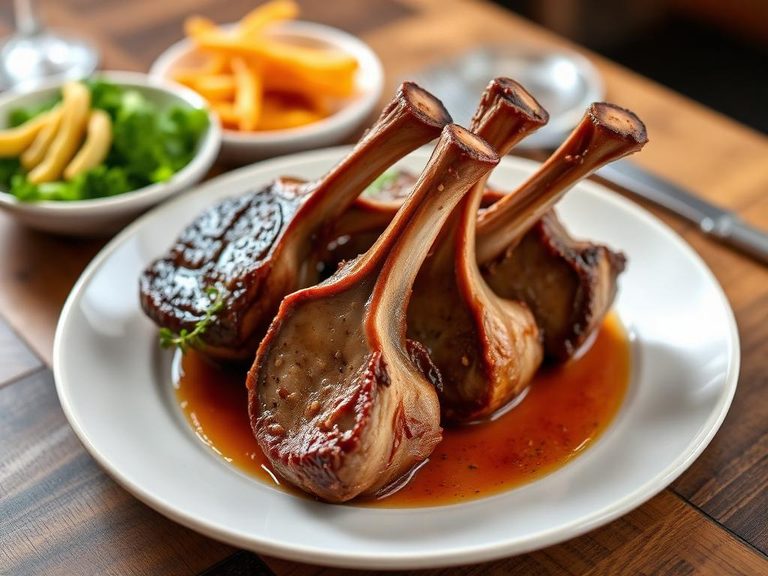
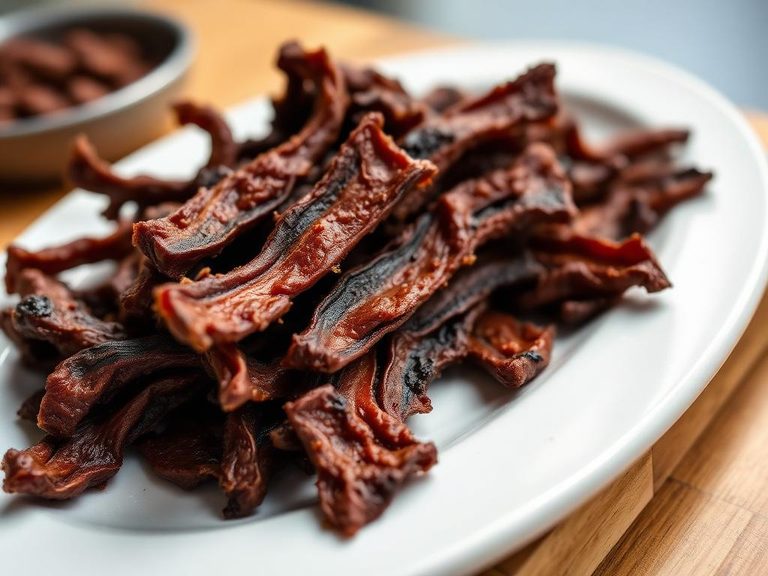
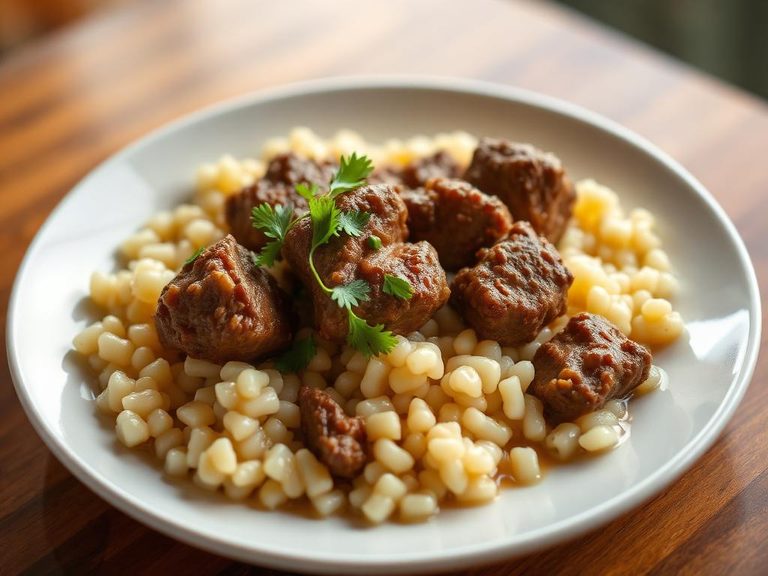
🍽️ Popular dishes
🌍 Where it's eaten
💡 Did you know?
In traditional Navajo culture, the roasting of a whole sheep or goat in an earthen pit, known as a 'hogan' or 'pit roast,' is a communal feast reserved for significant ceremonies and celebrations.
Full nutrition (USDA data · scales with serving)
| Water | 54.0 g |
| Energy | 234 kcal |
| Energy | 978 kj |
| Protein | 33.4 g |
| Total lipid (fat) | 11.1 g |
| Ash | 1.4 g |
| Carbohydrate, by difference | 0.08 g |
| Calcium, Ca | 10.0 mg |
| Iron, Fe | 4.8 mg |
| Magnesium, Mg | 31.0 mg |
| Phosphorus, P | 272 mg |
| Potassium, K | 409 mg |
| Sodium, Na | 135 mg |
| Zinc, Zn | 5.9 mg |
| Copper, Cu | 0.06 mg |
| Manganese, Mn | 0.03 mg |
| Selenium, Se | 38.0 ug |
| Thiamin | 0.06 mg |
| Riboflavin | 0.30 mg |
| Niacin | 6.5 mg |
| Pantothenic acid | 0.90 mg |
| Vitamin B-6 | 0.38 mg |
| Folate, total | 0.00 ug |
| Folate, food | 0.00 ug |
| Choline, total | 101 mg |
| Betaine | 33.9 mg |
| Vitamin B-12 | 4.4 ug |
| Vitamin E (alpha-tocopherol) | 0.80 mg |
| Tocopherol, beta | 0.00 mg |
| Tocopherol, gamma | 0.00 mg |
| Tocopherol, delta | 0.00 mg |
| Tocotrienol, alpha | 0.00 mg |
| Tocotrienol, beta | 0.00 mg |
| Tocotrienol, gamma | 0.00 mg |
| Tocotrienol, delta | 0.00 mg |
| Vitamin K (Dihydrophylloquinone) | 0.00 ug |
Fat & fatty acid profile (per 100g)
| Fatty acids, total saturated | 5.1 g |
| SFA 8:0 | 0.00 g |
| SFA 10:0 | 0.01 g |
| SFA 12:0 | 0.01 g |
| SFA 14:0 | 0.26 g |
| SFA 15:0 | 0.06 g |
| SFA 16:0 | 2.5 g |
| SFA 17:0 | 0.16 g |
| SFA 18:0 | 2.1 g |
| SFA 20:0 | 0.02 g |
| SFA 22:0 | 0.00 g |
| Fatty acids, total monounsaturated | 4.5 g |
| MUFA 14:1 | 0.01 g |
| MUFA 15:1 | 0.00 g |
| MUFA 16:1 | 0.21 g |
| MUFA 17:1 | 0.09 g |
| MUFA 18:1 | 4.1 g |
| MUFA 20:1 | 0.01 g |
| Fatty acids, total polyunsaturated | 0.81 g |
| PUFA 18:2 | 0.40 g |
| PUFA 18:3 | 0.17 g |
| PUFA 18:3 n-3 c,c,c (ALA) | 0.15 g |
| PUFA 18:3 n-6 c,c,c | 0.03 g |
| PUFA 20:2 n-6 c,c | 0.00 g |
| PUFA 20:3 | 0.00 g |
| PUFA 20:4 | 0.07 g |
| Cholesterol | 109 mg |
Amino acid profile (per 100g)
| Tryptophan | 0.26 g |
| Threonine | 1.4 g |
| Isoleucine | 1.6 g |
| Leucine | 2.8 g |
| Lysine | 3.0 g |
| Methionine | 0.92 g |
| Cystine | 0.35 g |
| Phenylalanine | 1.4 g |
| Tyrosine | 1.2 g |
| Valine | 1.7 g |
| Arginine | 2.2 g |
| Histidine | 0.97 g |
| Alanine | 2.0 g |
| Aspartic acid | 3.1 g |
| Glutamic acid | 5.2 g |
| Glycine | 1.7 g |
| Proline | 1.4 g |
| Serine | 1.3 g |
| Hydroxyproline | 0.24 g |
FAQ
How is Navajo mutton different from regular lamb?
Navajo mutton typically comes from mature sheep, giving it a stronger, more pronounced flavor and firmer texture compared to younger lamb. The diet and free-range lifestyle of the sheep also contribute to its unique taste.
What's the best way to cook it to avoid toughness?
Slow, moist-heat cooking methods like braising, stewing, or roasting at low temperatures are ideal. Marinating beforehand can also help tenderize the meat.
Is it a healthy red meat option?
Yes, it's a nutrient-dense choice, high in protein and essential nutrients like iron and zinc. Its fat content is moderate, and it can be part of a balanced diet when consumed in appropriate portions.
Nutrient density (calculated · NRF9.3)
Nutrient Rich Foods index: beneficial nutrients (protein, fiber, vitamins, minerals) minus saturated fat, added sugar & sodium, per 100 kcal.
NRF9.3 index — Fulgoni, Keast & Drewnowski, 2009. Computed from USDA nutrients.
Weight-loss friendliness (composite index)
Energy density 2.34 kcal/g · 57% calories from protein · 0.0 g fiber · 0.0 g sugar per 100 g.
Composite of energy density (Rolls et al., 1999), protein & fiber satiety, minus sugar. A calculated heuristic — ranks satiety-per-calorie, not a clinical measure.
Dietary load (calculated from USDA values)
Potential renal acid load. Positive = acid-forming, negative = alkaline-forming.
Sodium-to-potassium ratio: 0.33 (lower is better — aim for ≤ 1)
Sodium:potassium per WHO potassium guidance. Computed from USDA nutrients.