

Peach, frozen
Common food

Photo: Wikipedia
Frozen peaches are flash-frozen at peak ripeness, capturing the fruit's sweet, floral essence and juicy, tender texture. They offer a convenient, year-round source of vitamin C and fiber, with a nutrition profile nearly identical to fresh peaches. Their natural sweetness makes them a versatile ingredient for both sweet and savory dishes.
Calorie split: 8% protein · 87% carbs · 5% fat
↓ Full nutrition💚 Why it's loved
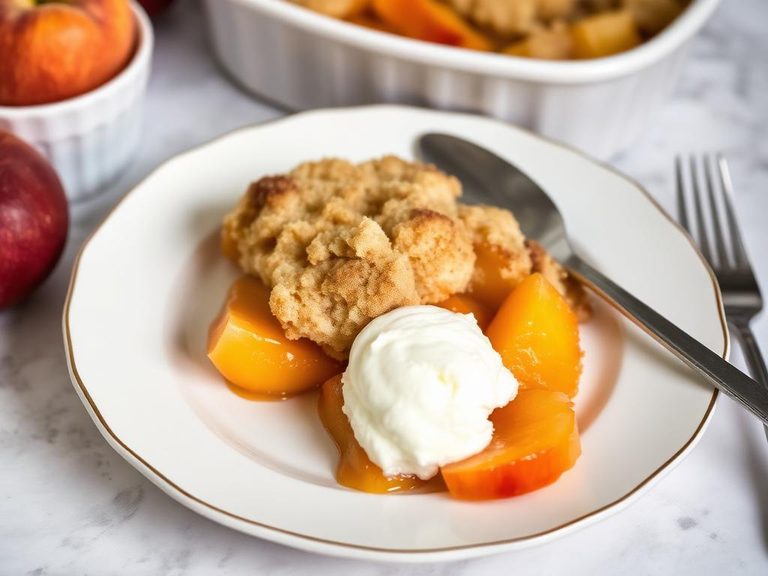
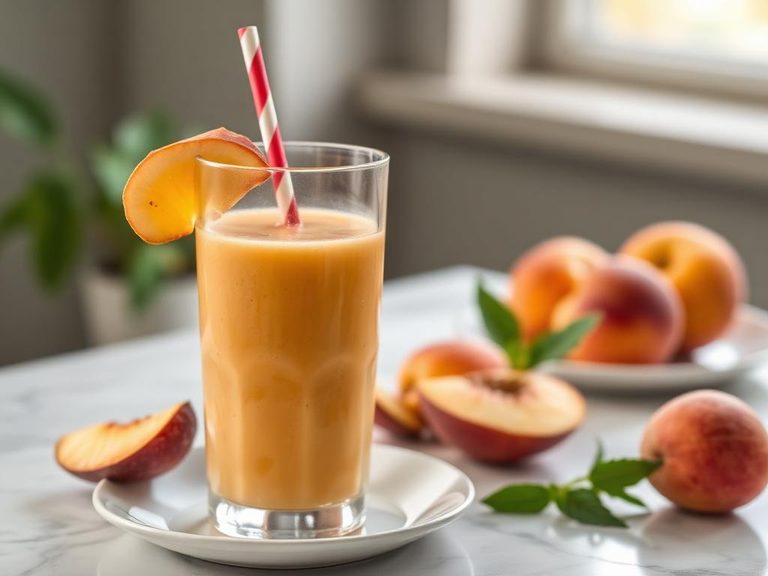
People love frozen peaches for their intense, concentrated sweetness and the ability to enjoy summer's flavor in any season. They are a staple in Southern U.S. cuisine and are cherished for their versatility in everything from cobblers to smoothies.
⚠️ Watch-outs & how to enjoy it better
The high natural sugar content (over 8g per 100g) can cause blood sugar spikes, so individuals with diabetes should practice portion control. To counteract this, pair them with a source of protein or healthy fat, like Greek yogurt or nuts, to slow sugar absorption. Always check labels for added sugars or syrups.
Key benefits
- Rich in vitamin C for immune support.
- Good source of dietary fiber for digestion.
- Contains antioxidants like beta-carotene.
- Convenient and reduces food waste.
- Naturally low in fat and sodium.
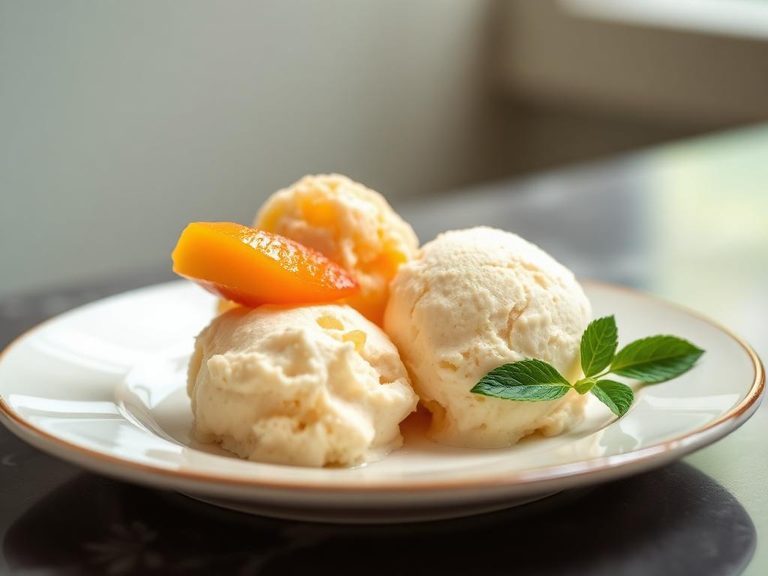
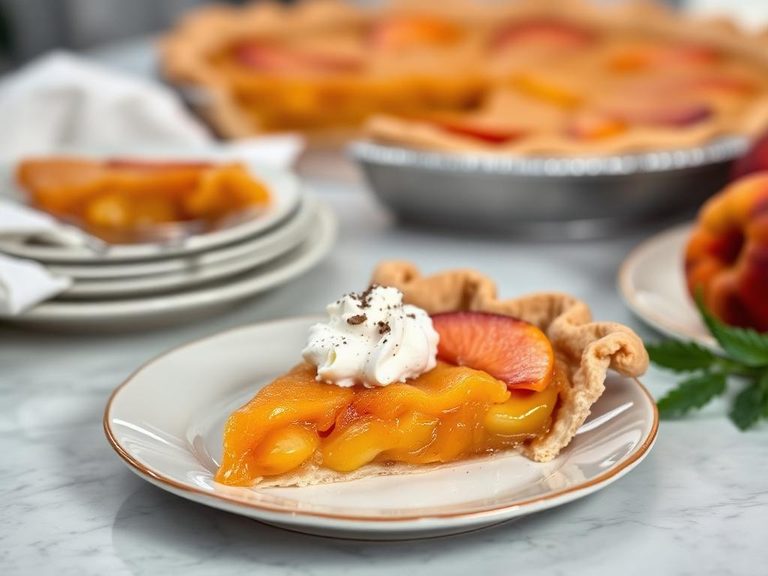
🍽️ Popular dishes
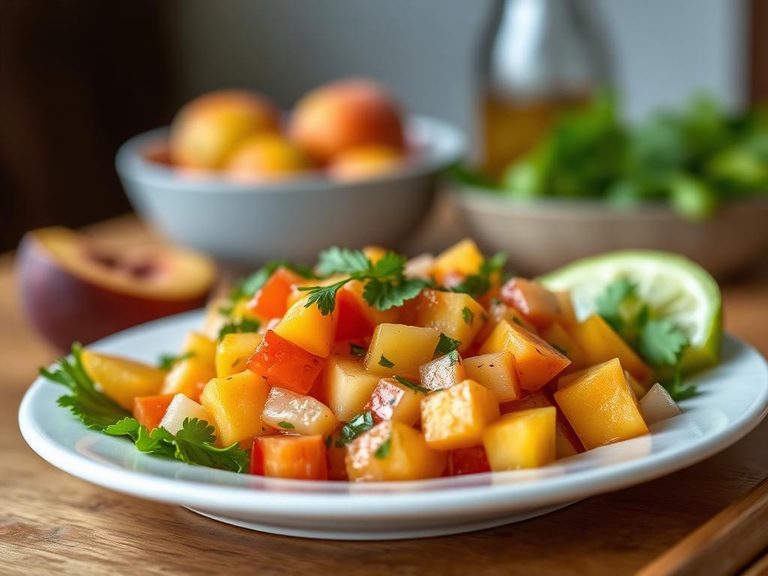

🌍 Where it's eaten
💡 Did you know?
Peaches were once called 'Persian apples' in Europe, and their fuzzy skin is a natural defense against insects and moisture loss.
Full nutrition (USDA data · scales with serving)
| Water | 88.3 g |
| Energy | 46.0 kcal |
| Protein | 0.91 g |
| Total lipid (fat) | 0.27 g |
| Carbohydrate, by difference | 10.1 g |
| Fiber, total dietary | 1.5 g |
| Total Sugars | 8.4 g |
| Calcium, Ca | 4.0 mg |
| Iron, Fe | 0.34 mg |
| Magnesium, Mg | 8.0 mg |
| Phosphorus, P | 22.0 mg |
| Potassium, K | 122 mg |
| Sodium, Na | 13.0 mg |
| Zinc, Zn | 0.23 mg |
| Copper, Cu | 0.08 mg |
| Selenium, Se | 2.1 ug |
| Vitamin C, total ascorbic acid | 4.1 mg |
| Thiamin | 0.02 mg |
| Riboflavin | 0.03 mg |
| Niacin | 0.81 mg |
| Vitamin B-6 | 0.03 mg |
| Folate, total | 6.0 ug |
| Folic acid | 0.00 ug |
| Folate, food | 6.0 ug |
| Folate, DFE | 6.0 ug |
| Choline, total | 6.1 mg |
| Vitamin B-12 | 0.00 ug |
| Vitamin B-12, added | 0.00 ug |
| Vitamin A, RAE | 24.0 ug |
| Retinol | 0.00 ug |
| Carotene, beta | 224 ug |
| Carotene, alpha | 0.00 ug |
| Cryptoxanthin, beta | 117 ug |
| Lycopene | 0.00 ug |
| Lutein + zeaxanthin | 132 ug |
| Vitamin E (alpha-tocopherol) | 0.73 mg |
| Vitamin E, added | 0.00 mg |
| Vitamin D (D2 + D3) | 0.00 ug |
| Vitamin K (phylloquinone) | 3.0 ug |
| Alcohol, ethyl | 0.00 g |
| Caffeine | 0.00 mg |
| Theobromine | 0.00 mg |
Fat & fatty acid profile (per 100g)
| Fatty acids, total saturated | 0.02 g |
| SFA 4:0 | 0.00 g |
| SFA 6:0 | 0.00 g |
| SFA 8:0 | 0.00 g |
| SFA 10:0 | 0.00 g |
| SFA 12:0 | 0.00 g |
| SFA 14:0 | 0.00 g |
| SFA 16:0 | 0.02 g |
| SFA 18:0 | 0.00 g |
| Fatty acids, total monounsaturated | 0.07 g |
| MUFA 16:1 | 0.00 g |
| MUFA 18:1 | 0.07 g |
| MUFA 20:1 | 0.00 g |
| MUFA 22:1 | 0.00 g |
| Fatty acids, total polyunsaturated | 0.09 g |
| PUFA 18:2 | 0.08 g |
| PUFA 18:3 | 0.00 g |
| PUFA 18:4 | 0.00 g |
| PUFA 20:4 | 0.00 g |
| PUFA 20:5 n-3 (EPA) | 0.00 g |
| PUFA 22:5 n-3 (DPA) | 0.00 g |
| PUFA 22:6 n-3 (DHA) | 0.00 g |
| Cholesterol | 0.00 mg |
Amino acid profile (per 100g)
Estimated from Peaches, canned, heavy syrup, drained — USDA does not publish this profile for Peach.
| Tryptophan | 0.01 g |
| Threonine | 0.01 g |
| Isoleucine | 0.01 g |
| Leucine | 0.02 g |
| Lysine | 0.02 g |
| Methionine | 0.01 g |
| Cystine | 0.01 g |
| Phenylalanine | 0.01 g |
| Tyrosine | 0.01 g |
| Valine | 0.01 g |
| Arginine | 0.01 g |
| Histidine | 0.01 g |
| Alanine | 0.02 g |
| Aspartic acid | 0.24 g |
| Glutamic acid | 0.03 g |
| Glycine | 0.01 g |
| Proline | 0.01 g |
| Serine | 0.02 g |
FAQ
Are frozen peaches as nutritious as fresh?
Yes, frozen peaches are often more nutritious because they are frozen at peak ripeness, locking in vitamins and antioxidants. Fresh peaches may lose nutrients during transport and storage.
How do I use frozen peaches in recipes?
You can use them directly in smoothies, baked goods, or sauces without thawing. For pies or cobblers, thaw and drain excess liquid first to avoid a soggy texture.
Do frozen peaches have added sugar?
Check the label—some brands add sugar or syrup. Look for 'no sugar added' options to avoid extra calories and sugar spikes.
Nutrient density (calculated · NRF9.3)
Nutrient Rich Foods index: beneficial nutrients (protein, fiber, vitamins, minerals) minus saturated fat, added sugar & sodium, per 100 kcal.
NRF9.3 index — Fulgoni, Keast & Drewnowski, 2009. Computed from USDA nutrients.
Weight-loss friendliness (composite index)
Energy density 0.46 kcal/g · 8% calories from protein · 1.5 g fiber · 8.4 g sugar per 100 g.
Composite of energy density (Rolls et al., 1999), protein & fiber satiety, minus sugar. A calculated heuristic — ranks satiety-per-calorie, not a clinical measure.
Dietary load (calculated from USDA values)
Potential renal acid load. Positive = acid-forming, negative = alkaline-forming.
Sodium-to-potassium ratio: 0.11 (lower is better — aim for ≤ 1)
Sodium:potassium per WHO potassium guidance. Computed from USDA nutrients.