

Bread, reduced-calorie, oat bran
Whole food · Baked Products

Photo: Wikipedia
This is a hearty, fiber-packed loaf made with oat bran, offering a subtly nutty flavor and a moist, dense crumb that's satisfying without being heavy. It's a smart choice for those seeking a lower-calorie bread that doesn't sacrifice texture, with a notable 12 grams of fiber per 100g to keep you full longer.
Calorie split: 14% protein · 73% carbs · 13% fat
↓ Full nutrition💚 Why it's loved
People appreciate its robust, wholesome flavor and the fact that it provides lasting energy without the post-carb slump, making it a staple for health-conscious breakfasts and lunches.
⚠️ Watch-outs & how to enjoy it better
Its dense texture and strong oat flavor can be an acquired taste, and it may cause digestive discomfort (bloating) for those not used to high fiber intake. To counteract this, start with smaller portions and ensure you drink plenty of water throughout the day.
Key benefits
- High in dietary fiber (12g per 100g) for digestive health.
- Good source of plant-based protein (8g per 100g).
- Lower in calories compared to standard breads.
- Contains oat beta-glucan, a soluble fiber linked to heart health.
- Low in fat (3.2g per 100g).
🍽️ Popular dishes
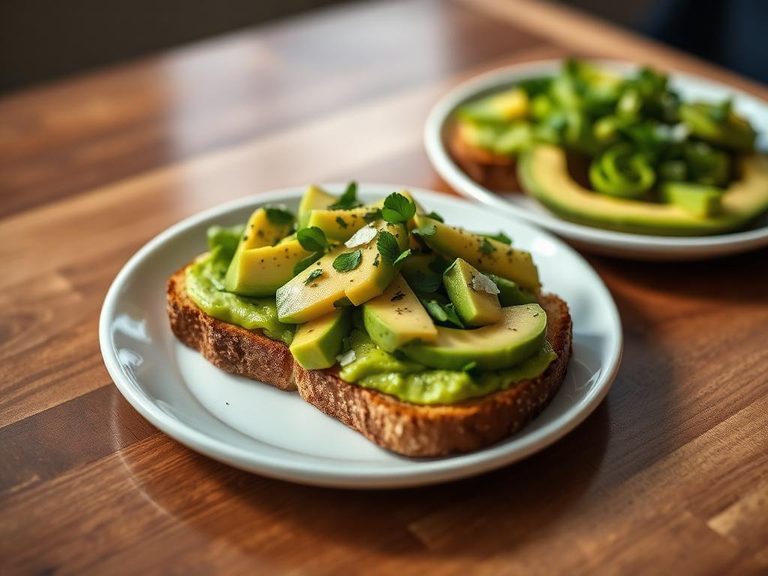
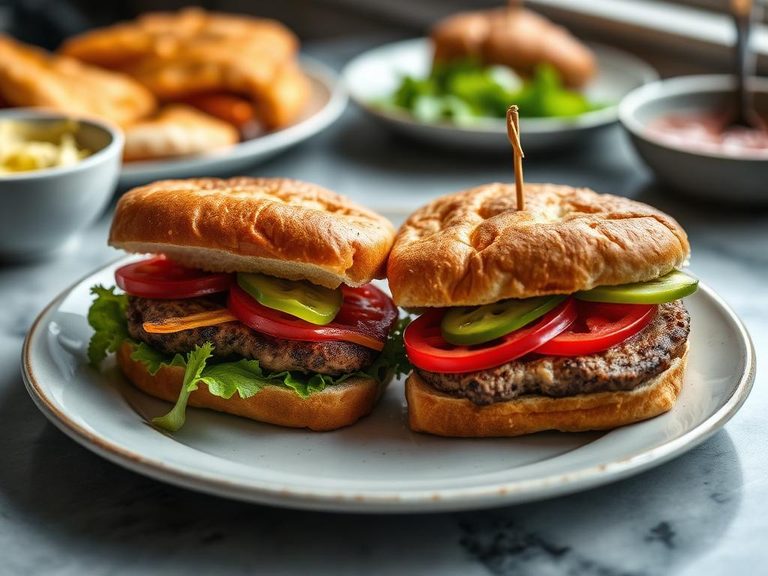
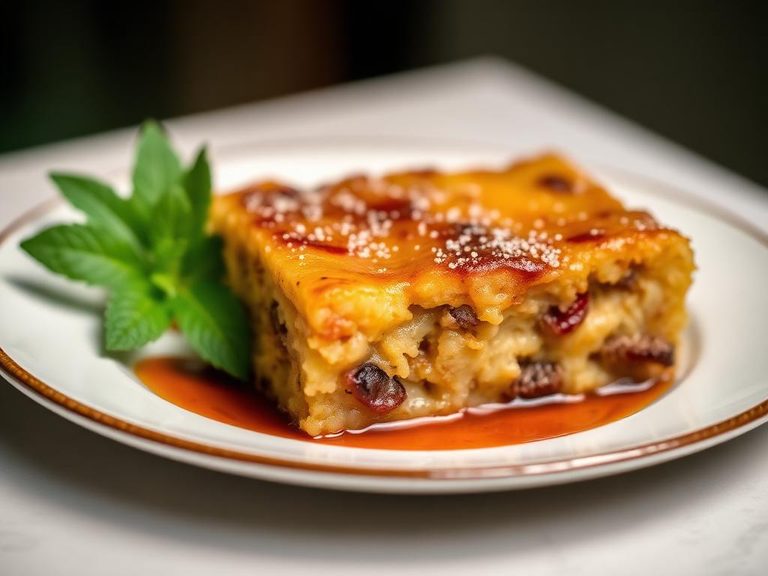


🌍 Where it's eaten
💡 Did you know?
Oat bran is the primary source of beta-glucan in oats, a soluble fiber that forms a gel in the gut, which can help slow the absorption of sugar.
Full nutrition (USDA data · scales with serving)
| Water | 46.0 g |
| Energy | 201 kcal |
| Energy | 841 kj |
| Protein | 8.0 g |
| Total lipid (fat) | 3.2 g |
| Ash | 1.5 g |
| Carbohydrate, by difference | 41.3 g |
| Fiber, total dietary | 12.0 g |
| Total Sugars | 3.5 g |
| Calcium, Ca | 57.0 mg |
| Iron, Fe | 3.1 mg |
| Magnesium, Mg | 55.0 mg |
| Phosphorus, P | 139 mg |
| Potassium, K | 102 mg |
| Sodium, Na | 459 mg |
| Zinc, Zn | 1.1 mg |
| Copper, Cu | 0.29 mg |
| Manganese, Mn | 1.1 mg |
| Selenium, Se | 20.6 ug |
| Vitamin C, total ascorbic acid | 0.00 mg |
| Thiamin | 0.35 mg |
| Riboflavin | 0.20 mg |
| Niacin | 3.8 mg |
| Pantothenic acid | 0.49 mg |
| Vitamin B-6 | 0.10 mg |
| Folate, total | 81.0 ug |
| Folic acid | 47.0 ug |
| Folate, food | 34.0 ug |
| Folate, DFE | 114 ug |
| Choline, total | 14.6 mg |
| Vitamin B-12 | 0.00 ug |
| Vitamin B-12, added | 0.00 ug |
| Vitamin A, RAE | 0.00 ug |
| Retinol | 0.00 ug |
| Carotene, beta | 1.0 ug |
| Carotene, alpha | 0.00 ug |
| Cryptoxanthin, beta | 0.00 ug |
| Vitamin A, IU | 2.0 iu |
| Lycopene | 0.00 ug |
| Lutein + zeaxanthin | 42.0 ug |
| Vitamin E (alpha-tocopherol) | 0.28 mg |
| Vitamin E, added | 0.00 mg |
| Vitamin D (D2 + D3), International Units | 0.00 iu |
| Vitamin D (D2 + D3) | 0.00 ug |
| Vitamin K (phylloquinone) | 1.7 ug |
| Alcohol, ethyl | 0.00 g |
| Caffeine | 0.00 mg |
| Theobromine | 0.00 mg |
Fat & fatty acid profile (per 100g)
| Fatty acids, total saturated | 0.45 g |
| SFA 4:0 | 0.00 g |
| SFA 6:0 | 0.00 g |
| SFA 8:0 | 0.00 g |
| SFA 10:0 | 0.00 g |
| SFA 12:0 | 0.00 g |
| SFA 14:0 | 0.00 g |
| SFA 16:0 | 0.37 g |
| SFA 18:0 | 0.07 g |
| Fatty acids, total monounsaturated | 0.68 g |
| MUFA 16:1 | 0.02 g |
| MUFA 18:1 | 0.66 g |
| MUFA 20:1 | 0.00 g |
| MUFA 22:1 | 0.00 g |
| Fatty acids, total polyunsaturated | 1.7 g |
| PUFA 18:2 | 1.6 g |
| PUFA 18:3 | 0.10 g |
| PUFA 18:4 | 0.00 g |
| PUFA 20:4 | 0.00 g |
| PUFA 20:5 n-3 (EPA) | 0.00 g |
| PUFA 22:5 n-3 (DPA) | 0.00 g |
| PUFA 22:6 n-3 (DHA) | 0.00 g |
| Cholesterol | 0.00 mg |
Amino acid profile (per 100g)
| Tryptophan | 0.10 g |
| Threonine | 0.26 g |
| Isoleucine | 0.32 g |
| Leucine | 0.56 g |
| Lysine | 0.29 g |
| Methionine | 0.14 g |
| Cystine | 0.14 g |
| Phenylalanine | 0.17 g |
| Tyrosine | 0.39 g |
| Valine | 0.36 g |
| Arginine | 0.38 g |
| Histidine | 0.18 g |
| Alanine | 0.31 g |
| Aspartic acid | 0.53 g |
| Glutamic acid | 2.2 g |
| Glycine | 0.32 g |
| Proline | 0.71 g |
| Serine | 0.39 g |
FAQ
Is this bread gluten-free?
Not necessarily. While oats are naturally gluten-free, they are often processed in facilities with wheat. Look for a certified gluten-free label if you have celiac disease or sensitivity.
How does it compare to whole wheat bread nutritionally?
Reduced-calorie oat bran bread typically has more fiber and a slightly lower glycemic index than standard whole wheat bread, but protein content can be similar.
What's the best way to store it?
Due to its moisture content, it's best stored sliced in the freezer to prevent mold and maintain freshness. Toast directly from frozen.
Nutrient density (calculated · NRF9.3)
Nutrient Rich Foods index: beneficial nutrients (protein, fiber, vitamins, minerals) minus saturated fat, added sugar & sodium, per 100 kcal.
NRF9.3 index — Fulgoni, Keast & Drewnowski, 2009. Computed from USDA nutrients.
Weight-loss friendliness (composite index)
Energy density 2.01 kcal/g · 16% calories from protein · 12.0 g fiber · 3.5 g sugar per 100 g.
Composite of energy density (Rolls et al., 1999), protein & fiber satiety, minus sugar. A calculated heuristic — ranks satiety-per-calorie, not a clinical measure.
Dietary load (calculated from USDA values)
Potential renal acid load. Positive = acid-forming, negative = alkaline-forming.
Sodium-to-potassium ratio: 4.50 (lower is better — aim for ≤ 1)
Sodium:potassium per WHO potassium guidance. Computed from USDA nutrients.