

Bread, sour dough, toasted
Common food

Photo: Wikipedia
Sourdough toast is a slice of tangy, chewy bread transformed by heat into a golden, crisp-edged canvas with a soft, airy interior. Its distinct sourness comes from natural fermentation, which also gives it a more complex flavor and satisfying texture than standard toast. Nutritionally, it offers a solid protein boost and is notably lower in sugar than many other breads.
Calorie split: 16% protein · 76% carbs · 8% fat
↓ Full nutrition💚 Why it's loved
People adore its signature tangy flavor and the perfect textural contrast between a crisp crust and a chewy crumb. It's a beloved, versatile base that elevates everything from avocado to eggs.
⚠️ Watch-outs & how to enjoy it better
Its density and chewiness can be tough for some, and the fermentation acids may aggravate acid reflux. For blood sugar management, the carbs are still significant—pair with protein or healthy fat and watch portion size.
Key benefits
- Lower glycemic index than conventional white bread
- Natural fermentation may improve mineral absorption
- Good source of plant-based protein
- Contains prebiotics from fermentation
- Simple ingredient list: flour, water, salt, starter
🍽️ Popular dishes
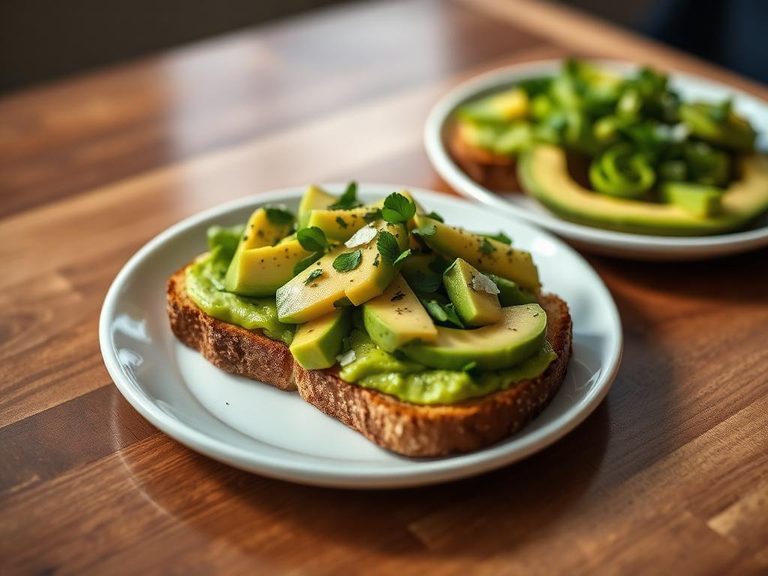
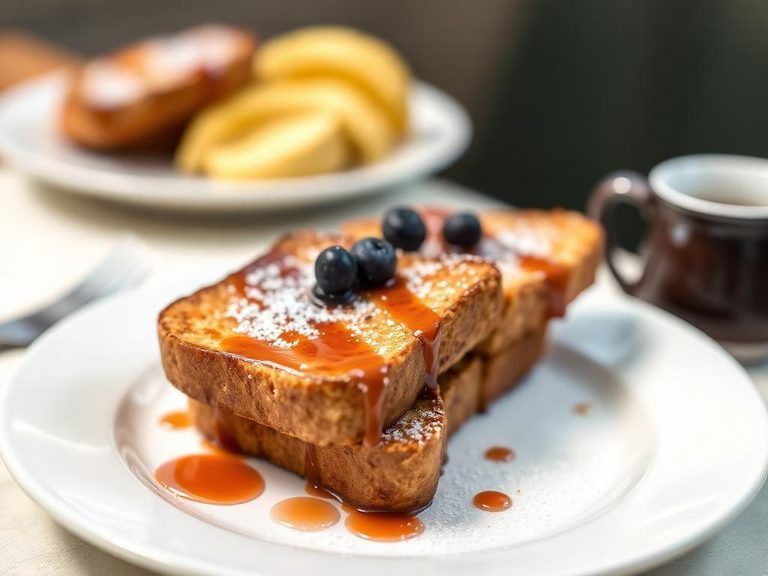
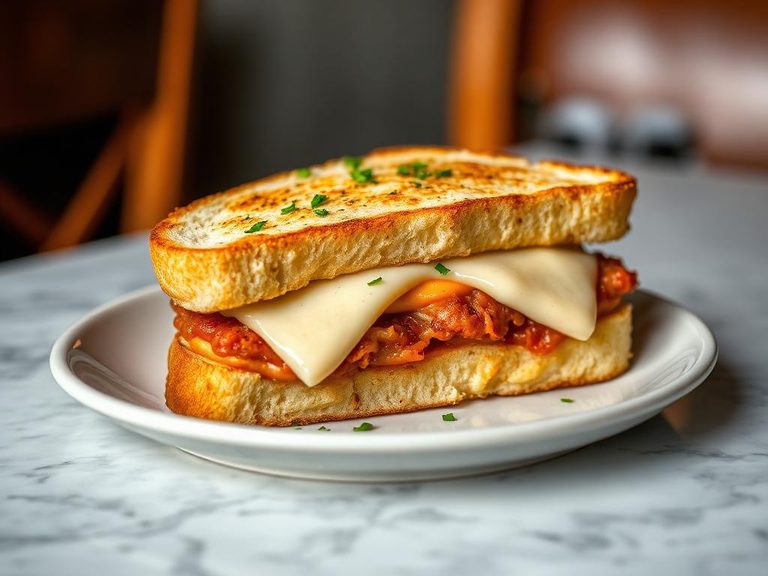
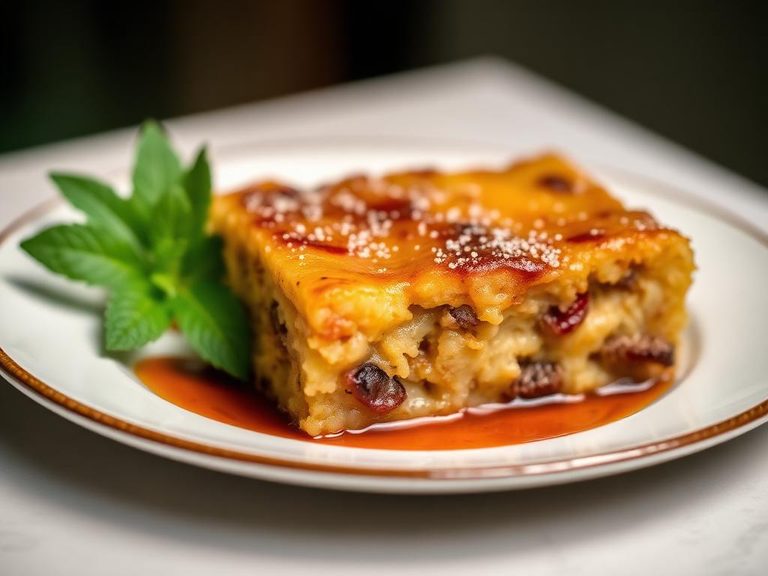
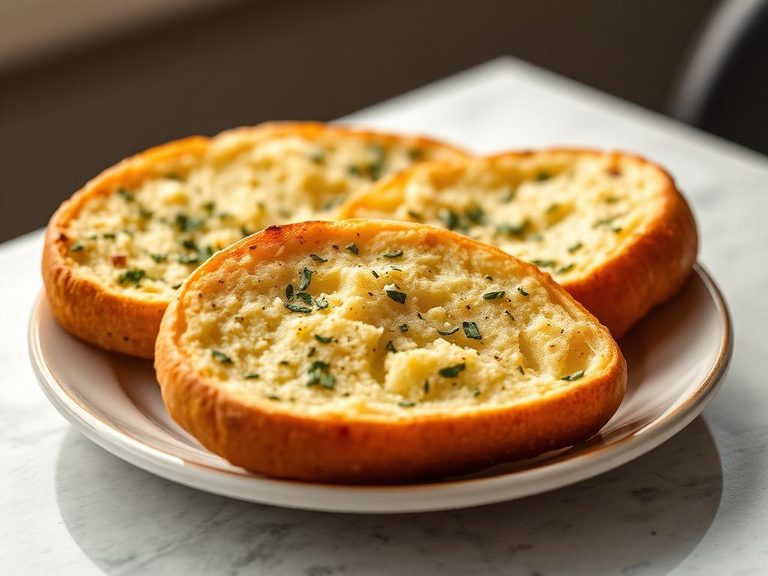
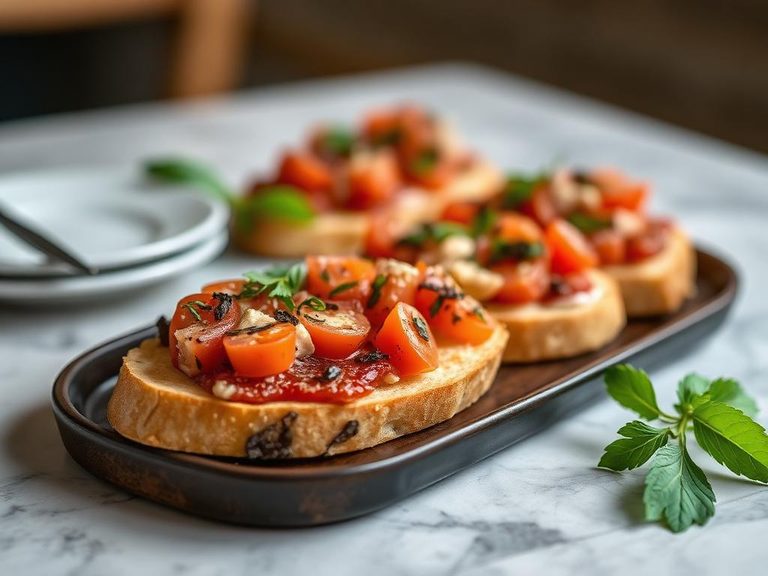
🌍 Where it's eaten
💡 Did you know?
The wild yeast and bacteria in a sourdough starter can live for decades, with some famous starters being over 100 years old.
Full nutrition (USDA data · scales with serving)
| Water | 26.4 g |
| Energy | 299 kcal |
| Protein | 11.8 g |
| Total lipid (fat) | 2.7 g |
| Carbohydrate, by difference | 57.0 g |
| Fiber, total dietary | 2.4 g |
| Total Sugars | 5.1 g |
| Calcium, Ca | 57.0 mg |
| Iron, Fe | 4.3 mg |
| Magnesium, Mg | 35.0 mg |
| Phosphorus, P | 115 mg |
| Potassium, K | 129 mg |
| Sodium, Na | 662 mg |
| Zinc, Zn | 1.1 mg |
| Copper, Cu | 0.17 mg |
| Selenium, Se | 31.4 ug |
| Vitamin C, total ascorbic acid | 0.00 mg |
| Thiamin | 0.62 mg |
| Riboflavin | 0.47 mg |
| Niacin | 5.3 mg |
| Vitamin B-6 | 0.12 mg |
| Folate, total | 115 ug |
| Folic acid | 89.0 ug |
| Folate, food | 26.0 ug |
| Folate, DFE | 177 ug |
| Choline, total | 8.8 mg |
| Vitamin B-12 | 0.00 ug |
| Vitamin B-12, added | 0.00 ug |
| Vitamin A, RAE | 0.00 ug |
| Retinol | 0.00 ug |
| Carotene, beta | 0.00 ug |
| Carotene, alpha | 0.00 ug |
| Cryptoxanthin, beta | 0.00 ug |
| Lycopene | 0.00 ug |
| Lutein + zeaxanthin | 47.0 ug |
| Vitamin E (alpha-tocopherol) | 0.23 mg |
| Vitamin E, added | 0.00 mg |
| Vitamin D (D2 + D3) | 0.00 ug |
| Vitamin K (phylloquinone) | 0.80 ug |
| Alcohol, ethyl | 0.00 g |
| Caffeine | 0.00 mg |
| Theobromine | 0.00 mg |
Fat & fatty acid profile (per 100g)
| Fatty acids, total saturated | 0.58 g |
| SFA 4:0 | 0.00 g |
| SFA 6:0 | 0.00 g |
| SFA 8:0 | 0.00 g |
| SFA 10:0 | 0.00 g |
| SFA 12:0 | 0.00 g |
| SFA 14:0 | 0.01 g |
| SFA 16:0 | 0.40 g |
| SFA 18:0 | 0.15 g |
| Fatty acids, total monounsaturated | 0.40 g |
| MUFA 16:1 | 0.01 g |
| MUFA 18:1 | 0.38 g |
| MUFA 20:1 | 0.01 g |
| MUFA 22:1 | 0.00 g |
| Fatty acids, total polyunsaturated | 0.94 g |
| PUFA 18:2 | 0.87 g |
| PUFA 18:3 | 0.07 g |
| PUFA 18:4 | 0.00 g |
| PUFA 20:4 | 0.00 g |
| PUFA 20:5 n-3 (EPA) | 0.00 g |
| PUFA 22:5 n-3 (DPA) | 0.00 g |
| PUFA 22:6 n-3 (DHA) | 0.00 g |
| Cholesterol | 0.00 mg |
Amino acid profile (per 100g)
Estimated from Bread, salvadoran sweet cheese (quesadilla salvadorena) — USDA does not publish this profile for Bread.
| Tryptophan | 0.07 g |
| Threonine | 0.21 g |
| Isoleucine | 0.30 g |
| Leucine | 0.65 g |
| Lysine | 0.50 g |
| Methionine | 0.28 g |
| Cystine | 0.06 g |
| Phenylalanine | 0.37 g |
| Tyrosine | 0.23 g |
| Valine | 0.43 g |
| Arginine | 0.25 g |
| Histidine | 0.15 g |
| Alanine | 0.36 g |
| Aspartic acid | 0.59 g |
| Glutamic acid | 1.3 g |
| Glycine | 0.20 g |
| Proline | 0.83 g |
| Serine | 0.45 g |
| Hydroxyproline | 0.00 g |
FAQ
Is sourdough toast healthier than regular toast?
Generally, yes. The fermentation process lowers the glycemic index, which can lead to a slower rise in blood sugar. It also may make nutrients like iron and zinc more absorbable.
Why is sourdough less likely to spike blood sugar?
The organic acids produced during fermentation slow down the rate at which starches are broken down into sugars in your digestive system.
Can people with gluten sensitivity eat sourdough?
While the fermentation process breaks down some gluten, sourdough is not gluten-free. It is not safe for people with celiac disease, but some with non-celiac gluten sensitivity report better tolerance.
Nutrient density (calculated · NRF9.3)
Nutrient Rich Foods index: beneficial nutrients (protein, fiber, vitamins, minerals) minus saturated fat, added sugar & sodium, per 100 kcal.
NRF9.3 index — Fulgoni, Keast & Drewnowski, 2009. Computed from USDA nutrients.
Weight-loss friendliness (composite index)
Energy density 2.99 kcal/g · 16% calories from protein · 2.4 g fiber · 5.1 g sugar per 100 g.
Composite of energy density (Rolls et al., 1999), protein & fiber satiety, minus sugar. A calculated heuristic — ranks satiety-per-calorie, not a clinical measure.
Dietary load (calculated from USDA values)
Potential renal acid load. Positive = acid-forming, negative = alkaline-forming.
Sodium-to-potassium ratio: 5.13 (lower is better — aim for ≤ 1)
Sodium:potassium per WHO potassium guidance. Computed from USDA nutrients.