

Fish, catfish, baked or broiled, coated
Common food

Photo: Wikipedia
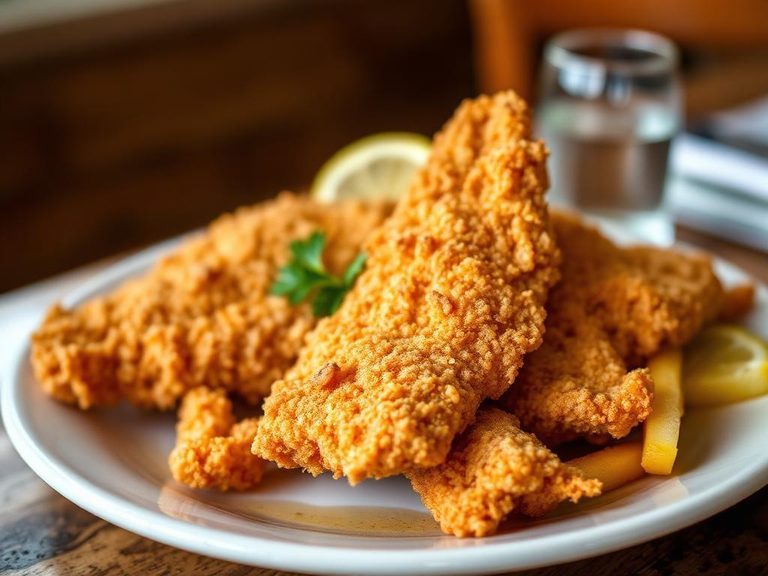
This is catfish fillets that have been coated in a seasoned breading or batter and then baked or broiled to a golden crisp. The coating provides a satisfying crunch that gives way to the mild, slightly sweet, and flaky white fish inside. Nutritionally, it's a solid source of protein with a moderate amount of fat, largely from the coating.
Calorie split: 35% protein · 16% carbs · 50% fat
↓ Full nutrition💚 Why it's loved
People adore the textural contrast between the crispy, seasoned coating and the tender, flaky fish. It's a beloved comfort food in the American South, celebrated for its hearty, satisfying flavor that pairs perfectly with tangy coleslaw or tartar sauce.
⚠️ Watch-outs & how to enjoy it better
The coating can significantly increase the sodium and refined carbohydrate content compared to plain fish. Those monitoring blood sugar or sodium intake should be mindful of portion size and dipping sauces. To counteract this, pair it with a large portion of non-starchy vegetables and choose a vinegar-based sauce over a creamy, sugary one.
Key benefits
- Good source of complete protein for muscle maintenance.
- Baking or broiling is a lower-fat cooking method than deep frying.
- Contains essential nutrients like selenium and vitamin B12.
- A mild-flavored fish that is approachable for seafood beginners.
🍽️ Popular dishes

🌍 Where it's eaten
💡 Did you know?
Catfish are named for their prominent barbels, which resemble a cat's whiskers and are used to taste and smell their food in murky waters.
Full nutrition (USDA data · scales with serving)
| Water | 63.4 g |
| Energy | 205 kcal |
| Protein | 17.2 g |
| Total lipid (fat) | 11.1 g |
| Carbohydrate, by difference | 7.8 g |
| Fiber, total dietary | 0.30 g |
| Total Sugars | 0.14 g |
| Calcium, Ca | 19.0 mg |
| Iron, Fe | 0.83 mg |
| Magnesium, Mg | 23.0 mg |
| Phosphorus, P | 229 mg |
| Potassium, K | 333 mg |
| Sodium, Na | 366 mg |
| Zinc, Zn | 0.60 mg |
| Copper, Cu | 0.05 mg |
| Selenium, Se | 10.7 ug |
| Vitamin C, total ascorbic acid | 0.00 mg |
| Thiamin | 0.11 mg |
| Riboflavin | 0.13 mg |
| Niacin | 2.9 mg |
| Vitamin B-6 | 0.18 mg |
| Folate, total | 26.0 ug |
| Folic acid | 13.0 ug |
| Folate, food | 13.0 ug |
| Folate, DFE | 35.0 ug |
| Choline, total | 73.0 mg |
| Vitamin B-12 | 2.7 ug |
| Vitamin B-12, added | 0.00 ug |
| Vitamin A, RAE | 22.0 ug |
| Retinol | 21.0 ug |
| Carotene, beta | 9.0 ug |
| Carotene, alpha | 0.00 ug |
| Cryptoxanthin, beta | 0.00 ug |
| Lycopene | 0.00 ug |
| Lutein + zeaxanthin | 7.0 ug |
| Vitamin E (alpha-tocopherol) | 1.5 mg |
| Vitamin E, added | 0.00 mg |
| Vitamin D (D2 + D3) | 0.30 ug |
| Vitamin K (phylloquinone) | 6.1 ug |
| Alcohol, ethyl | 0.00 g |
| Caffeine | 0.00 mg |
| Theobromine | 0.00 mg |
Fat & fatty acid profile (per 100g)
| Fatty acids, total saturated | 2.6 g |
| SFA 4:0 | 0.03 g |
| SFA 6:0 | 0.02 g |
| SFA 8:0 | 0.01 g |
| SFA 10:0 | 0.03 g |
| SFA 12:0 | 0.04 g |
| SFA 14:0 | 0.17 g |
| SFA 16:0 | 1.7 g |
| SFA 18:0 | 0.56 g |
| Fatty acids, total monounsaturated | 4.4 g |
| MUFA 16:1 | 0.17 g |
| MUFA 18:1 | 4.0 g |
| MUFA 20:1 | 0.10 g |
| MUFA 22:1 | 0.00 g |
| Fatty acids, total polyunsaturated | 2.6 g |
| PUFA 18:2 | 2.1 g |
| PUFA 18:3 | 0.23 g |
| PUFA 18:4 | 0.00 g |
| PUFA 20:4 | 0.05 g |
| PUFA 20:5 n-3 (EPA) | 0.02 g |
| PUFA 22:5 n-3 (DPA) | 0.02 g |
| PUFA 22:6 n-3 (DHA) | 0.06 g |
| Cholesterol | 65.0 mg |
Amino acid profile (per 100g)
Estimated from Fish, fish sticks, frozen, prepared — USDA does not publish this profile for Fish.
| Tryptophan | 0.12 g |
| Threonine | 0.37 g |
| Isoleucine | 0.43 g |
| Leucine | 0.85 g |
| Lysine | 0.80 g |
| Methionine | 0.30 g |
| Phenylalanine | 0.47 g |
| Tyrosine | 0.29 g |
| Valine | 0.50 g |
| Arginine | 0.59 g |
| Histidine | 0.23 g |
| Alanine | 0.55 g |
| Aspartic acid | 0.82 g |
| Glutamic acid | 2.3 g |
| Glycine | 0.47 g |
| Proline | 0.78 g |
| Serine | 0.49 g |
| Hydroxyproline | 0.00 g |
FAQ
Is baked or broiled catfish healthier than fried?
Yes, baking or broiling uses significantly less added fat than deep frying, resulting in a lower overall calorie and fat content for the same amount of fish.
What is the coating typically made of?
Common coatings include cornmeal, flour, or a mix, seasoned with spices like paprika, garlic powder, onion powder, salt, and pepper. Some recipes use a buttermilk soak first to help the coating adhere.
Can I make this with other types of fish?
Absolutely. The baking or broiling method with a coating works well with other mild, white-fleshed fish like tilapia, cod, or haddock.
Nutrient density (calculated · NRF9.3)
Nutrient Rich Foods index: beneficial nutrients (protein, fiber, vitamins, minerals) minus saturated fat, added sugar & sodium, per 100 kcal.
NRF9.3 index — Fulgoni, Keast & Drewnowski, 2009. Computed from USDA nutrients.
Weight-loss friendliness (composite index)
Energy density 2.05 kcal/g · 34% calories from protein · 0.3 g fiber · 0.1 g sugar per 100 g.
Composite of energy density (Rolls et al., 1999), protein & fiber satiety, minus sugar. A calculated heuristic — ranks satiety-per-calorie, not a clinical measure.
Dietary load (calculated from USDA values)
Potential renal acid load. Positive = acid-forming, negative = alkaline-forming.
Sodium-to-potassium ratio: 1.10 (lower is better — aim for ≤ 1)
Sodium:potassium per WHO potassium guidance. Computed from USDA nutrients.