

Coffee, Latte, decaffeinated, nonfat
Common food

Photo: Wikipedia
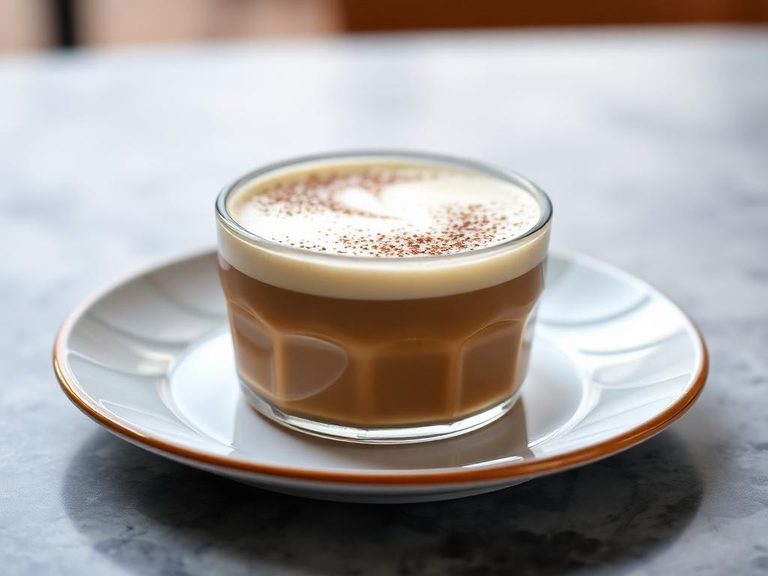
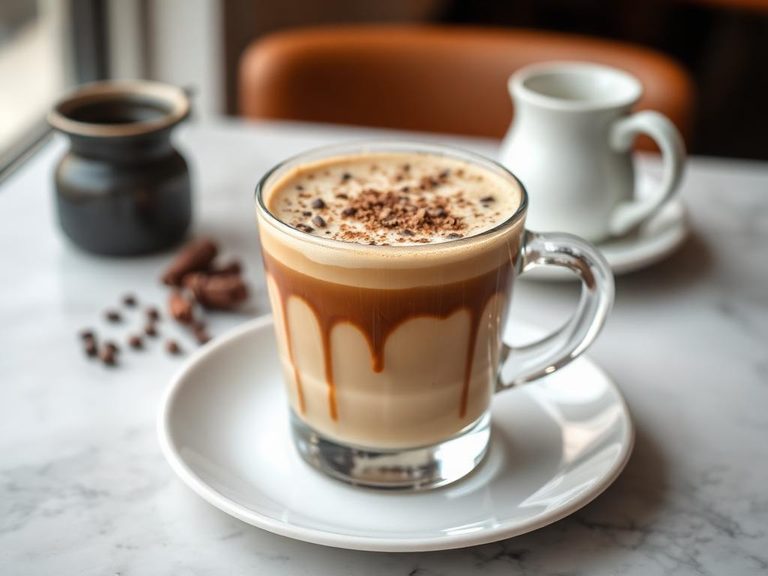
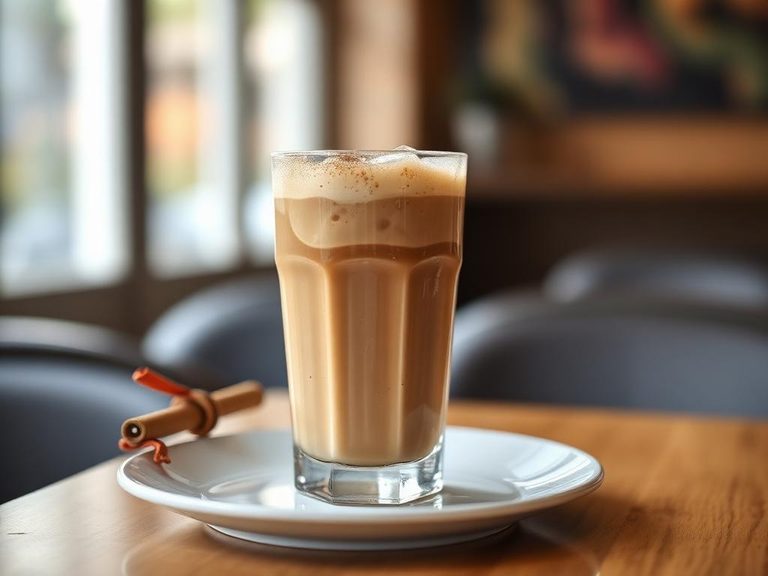
A decaffeinated latte made with nonfat milk offers the creamy, comforting ritual of a classic coffeehouse drink without the caffeine jolt. Its taste is smooth and mildly sweet, with the espresso's roasted notes softened by the light, frothy texture of steamed milk. Nutritionally, it's a lean choice, providing a modest protein boost with minimal calories and fat.
Calorie split: 38% protein · 59% carbs · 3% fat
↓ Full nutrition💚 Why it's loved
People love it for the familiar, velvety mouthfeel and the ability to enjoy a café-style treat at any hour without disrupting sleep. It's a versatile base for flavor additions like cinnamon, vanilla, or a sprinkle of cocoa powder.
⚠️ Watch-outs & how to enjoy it better
The natural sugars (lactose) in milk can cause blood-sugar spikes for some, and the lack of fat may make it less satiating. To counteract this, pair it with a source of protein or healthy fat (like a handful of nuts or a boiled egg) to slow sugar absorption and increase fullness.
Key benefits
- Provides a calcium and protein source from nonfat milk.
- Offers the ritual and comfort of a coffeehouse beverage without caffeine.
- Low in fat and calories, making it a lighter option than whole-milk lattes.
- Can be a satisfying, warm drink for evening or for caffeine-sensitive individuals.
🍽️ Popular dishes
🌍 Where it's eaten
💡 Did you know?
The 'latte' in 'caffè latte' is Italian for 'milk,' and the drink as we know it was popularized in the United States, not Italy, where a 'caffè latte' is simply a coffee with milk.
Full nutrition (USDA data · scales with serving)
| Water | 92.0 g |
| Energy | 30.0 kcal |
| Protein | 2.9 g |
| Total lipid (fat) | 0.10 g |
| Carbohydrate, by difference | 4.4 g |
| Fiber, total dietary | 0.00 g |
| Total Sugars | 4.2 g |
| Calcium, Ca | 111 mg |
| Iron, Fe | 0.02 mg |
| Magnesium, Mg | 23.0 mg |
| Phosphorus, P | 91.0 mg |
| Potassium, K | 158 mg |
| Sodium, Na | 37.0 mg |
| Zinc, Zn | 0.38 mg |
| Copper, Cu | 0.01 mg |
| Selenium, Se | 1.7 ug |
| Vitamin C, total ascorbic acid | 0.00 mg |
| Thiamin | 0.04 mg |
| Riboflavin | 0.14 mg |
| Niacin | 0.95 mg |
| Vitamin B-6 | 0.04 mg |
| Folate, total | 2.0 ug |
| Folic acid | 0.00 ug |
| Folate, food | 2.0 ug |
| Folate, DFE | 2.0 ug |
| Choline, total | 13.9 mg |
| Vitamin B-12 | 0.39 ug |
| Vitamin B-12, added | 0.00 ug |
| Vitamin A, RAE | 53.0 ug |
| Retinol | 53.0 ug |
| Carotene, beta | 2.0 ug |
| Carotene, alpha | 0.00 ug |
| Cryptoxanthin, beta | 0.00 ug |
| Lycopene | 0.00 ug |
| Lutein + zeaxanthin | 0.00 ug |
| Vitamin E (alpha-tocopherol) | 0.00 mg |
| Vitamin E, added | 0.00 mg |
| Vitamin D (D2 + D3) | 0.90 ug |
| Vitamin K (phylloquinone) | 0.00 ug |
| Alcohol, ethyl | 0.00 g |
| Caffeine | 0.00 mg |
| Theobromine | 0.00 mg |
Fat & fatty acid profile (per 100g)
| Fatty acids, total saturated | 0.06 g |
| SFA 4:0 | 0.00 g |
| SFA 6:0 | 0.00 g |
| SFA 8:0 | 0.00 g |
| SFA 10:0 | 0.00 g |
| SFA 12:0 | 0.00 g |
| SFA 14:0 | 0.01 g |
| SFA 16:0 | 0.03 g |
| SFA 18:0 | 0.01 g |
| Fatty acids, total monounsaturated | 0.01 g |
| MUFA 16:1 | 0.00 g |
| MUFA 18:1 | 0.01 g |
| MUFA 20:1 | 0.00 g |
| MUFA 22:1 | 0.00 g |
| Fatty acids, total polyunsaturated | 0.02 g |
| PUFA 18:2 | 0.02 g |
| PUFA 18:3 | 0.00 g |
| PUFA 18:4 | 0.00 g |
| PUFA 20:4 | 0.00 g |
| PUFA 20:5 n-3 (EPA) | 0.00 g |
| PUFA 22:5 n-3 (DPA) | 0.00 g |
| PUFA 22:6 n-3 (DHA) | 0.00 g |
| Cholesterol | 3.0 mg |
Amino acid profile (per 100g)
Estimated from Cream, fluid, light (coffee cream or table cream) — USDA does not publish this profile for Coffee.
| Tryptophan | 0.07 g |
| Threonine | 0.13 g |
| Isoleucine | 0.15 g |
| Leucine | 0.24 g |
| Lysine | 0.13 g |
| Methionine | 0.07 g |
| Cystine | 0.01 g |
| Phenylalanine | 0.14 g |
| Tyrosine | 0.14 g |
| Valine | 0.18 g |
| Arginine | 0.07 g |
| Histidine | 0.07 g |
| Alanine | 0.09 g |
| Aspartic acid | 0.22 g |
| Glutamic acid | 0.59 g |
| Glycine | 0.07 g |
| Proline | 0.31 g |
| Serine | 0.10 g |
FAQ
Is a decaf latte completely caffeine-free?
No, decaffeination removes about 97% of caffeine, so a typical 12-oz decaf latte may still contain 3-15 mg of caffeine, compared to 60-90 mg in a regular latte.
Why is the protein content listed per 100g so low?
The 2.88g protein per 100g is for the entire beverage (espresso + milk). Since milk is the main protein source, a 12-oz (360g) serving would provide about 10g of protein.
Can I make this with plant-based milk?
Yes, but the nutrition facts will change significantly. For example, using unsweetened almond milk would drastically lower calories and protein, while using oat milk would increase carbohydrates.
Nutrient density (calculated · NRF9.3)
Nutrient Rich Foods index: beneficial nutrients (protein, fiber, vitamins, minerals) minus saturated fat, added sugar & sodium, per 100 kcal.
NRF9.3 index — Fulgoni, Keast & Drewnowski, 2009. Computed from USDA nutrients.
Weight-loss friendliness (composite index)
Energy density 0.30 kcal/g · 38% calories from protein · 0.0 g fiber · 4.2 g sugar per 100 g.
Composite of energy density (Rolls et al., 1999), protein & fiber satiety, minus sugar. A calculated heuristic — ranks satiety-per-calorie, not a clinical measure.
Dietary load (calculated from USDA values)
Potential renal acid load. Positive = acid-forming, negative = alkaline-forming.
Sodium-to-potassium ratio: 0.23 (lower is better — aim for ≤ 1)
Sodium:potassium per WHO potassium guidance. Computed from USDA nutrients.