

Coffee, Iced Latte, decaffeinated, nonfat, flavored
Common food

Photo: Wikipedia
A chilled, milky coffee drink that delivers a creamy, sweet, and subtly caffeinated experience without the jolt of regular espresso. Made with decaffeinated espresso, nonfat milk, and flavored syrup, it offers a light, frothy texture with a hint of vanilla or caramel. At just 32 kcal per 100g, it’s a low-calorie, guilt-free indulgence with minimal fat and a modest sugar content.
Calorie split: 22% protein · 76% carbs · 2% fat
↓ Full nutrition💚 Why it's loved
People adore its smooth, creamy texture and the ability to enjoy a sweet, coffee-flavored treat without the caffeine buzz. It’s a versatile, refreshing pick-me-up that fits into a low-calorie lifestyle and is often a staple in café culture.
⚠️ Watch-outs & how to enjoy it better
The added flavored syrup can cause blood-sugar spikes, especially for those with insulin sensitivity or diabetes. To mitigate this, pair it with a source of protein or healthy fat (like nuts or yogurt) and opt for smaller portions to control sugar intake.
Key benefits
- Low-calorie option for coffee lovers (32 kcal/100g)
- High protein content from nonfat milk (1.73g/100g)
- Minimal fat (0.08g/100g) for a light, refreshing drink
- Decaffeinated for evening or caffeine-sensitive consumers
- Flavored syrup adds sweetness without excessive sugar (5.92g/100g)
🍽️ Popular dishes
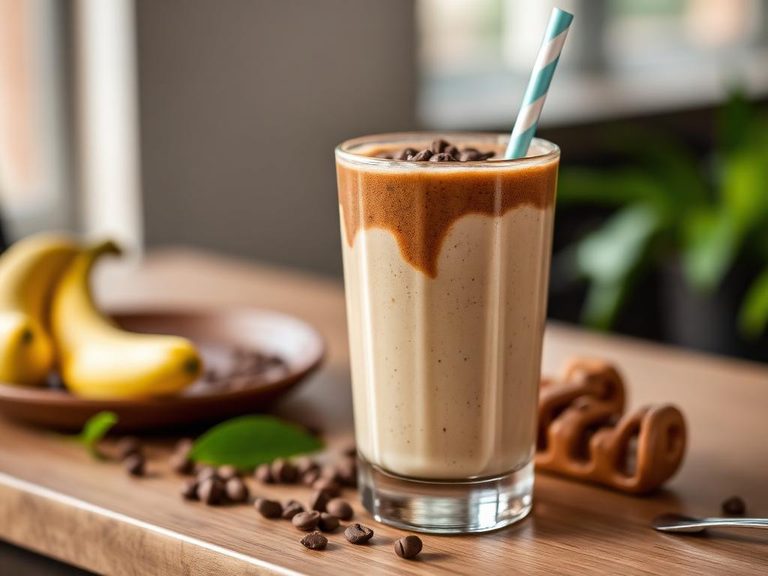

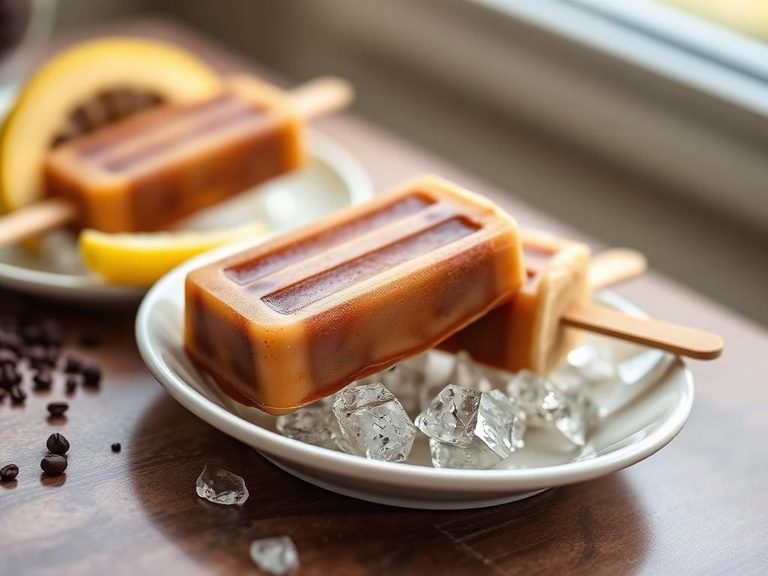
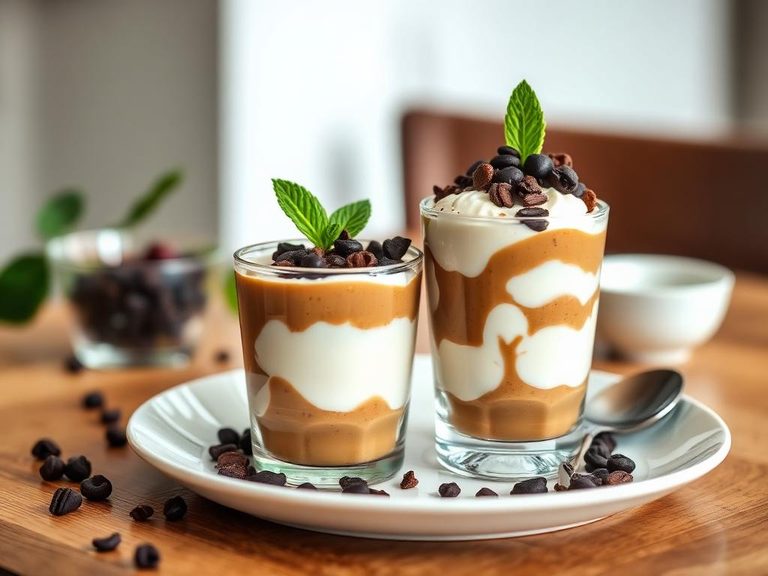
🌍 Where it's eaten
💡 Did you know?
The iced latte was popularized in the 1990s by coffee chains like Starbucks, but its roots trace back to Italy’s 'caffè freddo,' a chilled espresso drink often sweetened with sugar.
Full nutrition (USDA data · scales with serving)
| Water | 91.6 g |
| Energy | 32.0 kcal |
| Protein | 1.7 g |
| Total lipid (fat) | 0.08 g |
| Carbohydrate, by difference | 6.1 g |
| Fiber, total dietary | 0.00 g |
| Total Sugars | 5.9 g |
| Calcium, Ca | 67.0 mg |
| Iron, Fe | 0.02 mg |
| Magnesium, Mg | 19.0 mg |
| Phosphorus, P | 55.0 mg |
| Potassium, K | 103 mg |
| Sodium, Na | 24.0 mg |
| Zinc, Zn | 0.23 mg |
| Copper, Cu | 0.01 mg |
| Selenium, Se | 1.0 ug |
| Vitamin C, total ascorbic acid | 0.00 mg |
| Thiamin | 0.03 mg |
| Riboflavin | 0.10 mg |
| Niacin | 0.91 mg |
| Vitamin B-6 | 0.03 mg |
| Folate, total | 1.0 ug |
| Folic acid | 0.00 ug |
| Folate, food | 1.0 ug |
| Folate, DFE | 1.0 ug |
| Choline, total | 9.3 mg |
| Vitamin B-12 | 0.29 ug |
| Vitamin B-12, added | 0.00 ug |
| Vitamin A, RAE | 32.0 ug |
| Retinol | 32.0 ug |
| Carotene, beta | 1.0 ug |
| Carotene, alpha | 0.00 ug |
| Cryptoxanthin, beta | 0.00 ug |
| Lycopene | 0.00 ug |
| Lutein + zeaxanthin | 0.00 ug |
| Vitamin E (alpha-tocopherol) | 0.00 mg |
| Vitamin E, added | 0.00 mg |
| Vitamin D (D2 + D3) | 0.50 ug |
| Vitamin K (phylloquinone) | 0.00 ug |
| Alcohol, ethyl | 0.00 g |
| Caffeine | 0.00 mg |
| Theobromine | 0.00 mg |
Fat & fatty acid profile (per 100g)
| Fatty acids, total saturated | 0.04 g |
| SFA 4:0 | 0.00 g |
| SFA 6:0 | 0.00 g |
| SFA 8:0 | 0.00 g |
| SFA 10:0 | 0.00 g |
| SFA 12:0 | 0.00 g |
| SFA 14:0 | 0.00 g |
| SFA 16:0 | 0.02 g |
| SFA 18:0 | 0.00 g |
| Fatty acids, total monounsaturated | 0.01 g |
| MUFA 16:1 | 0.00 g |
| MUFA 18:1 | 0.01 g |
| MUFA 20:1 | 0.00 g |
| MUFA 22:1 | 0.00 g |
| Fatty acids, total polyunsaturated | 0.02 g |
| PUFA 18:2 | 0.02 g |
| PUFA 18:3 | 0.00 g |
| PUFA 18:4 | 0.00 g |
| PUFA 20:4 | 0.00 g |
| PUFA 20:5 n-3 (EPA) | 0.00 g |
| PUFA 22:5 n-3 (DPA) | 0.00 g |
| PUFA 22:6 n-3 (DHA) | 0.00 g |
| Cholesterol | 1.0 mg |
Amino acid profile (per 100g)
Estimated from Cream, fluid, light (coffee cream or table cream) — USDA does not publish this profile for Coffee.
| Tryptophan | 0.07 g |
| Threonine | 0.13 g |
| Isoleucine | 0.15 g |
| Leucine | 0.24 g |
| Lysine | 0.13 g |
| Methionine | 0.07 g |
| Cystine | 0.01 g |
| Phenylalanine | 0.14 g |
| Tyrosine | 0.14 g |
| Valine | 0.18 g |
| Arginine | 0.07 g |
| Histidine | 0.07 g |
| Alanine | 0.09 g |
| Aspartic acid | 0.22 g |
| Glutamic acid | 0.59 g |
| Glycine | 0.07 g |
| Proline | 0.31 g |
| Serine | 0.10 g |
FAQ
How does decaffeinated coffee differ from regular coffee in taste?
Decaffeinated coffee has a milder, less bitter flavor due to the removal of caffeine, which can make it taste smoother and less intense.
Is nonfat milk a good choice for iced lattes?
Yes, nonfat milk provides protein and calcium while keeping the drink low in fat and calories, making it a healthy option for those watching their intake.
Can flavored syrups in iced lattes be replaced with natural sweeteners?
Absolutely. You can use natural sweeteners like honey, maple syrup, or stevia to reduce sugar content while maintaining flavor.
Nutrient density (calculated · NRF9.3)
Nutrient Rich Foods index: beneficial nutrients (protein, fiber, vitamins, minerals) minus saturated fat, added sugar & sodium, per 100 kcal.
NRF9.3 index — Fulgoni, Keast & Drewnowski, 2009. Computed from USDA nutrients.
Weight-loss friendliness (composite index)
Energy density 0.32 kcal/g · 22% calories from protein · 0.0 g fiber · 5.9 g sugar per 100 g.
Composite of energy density (Rolls et al., 1999), protein & fiber satiety, minus sugar. A calculated heuristic — ranks satiety-per-calorie, not a clinical measure.
Dietary load (calculated from USDA values)
Potential renal acid load. Positive = acid-forming, negative = alkaline-forming.
Sodium-to-potassium ratio: 0.23 (lower is better — aim for ≤ 1)
Sodium:potassium per WHO potassium guidance. Computed from USDA nutrients.