

Bread, whole wheat, made from home recipe or purchased at bakery, toasted
Common food

Photo: Wikipedia
This is the classic, hearty staple of the breakfast table: slices of whole wheat bread, toasted to a firm, golden-brown crisp. Its flavor is nutty and robust, with a satisfying crunch that gives way to a chewy interior. Nutritionally, it's a solid source of complex carbohydrates and fiber, providing sustained energy without the crash of refined grains.
Calorie split: 16% protein · 70% carbs · 14% fat
↓ Full nutrition💚 Why it's loved
People love it for its comforting, toasty aroma and the satisfying crunch that elevates simple toppings. It's the ultimate versatile canvas, from sweet jam to savory avocado, and is deeply embedded in breakfast and snack culture worldwide.
⚠️ Watch-outs & how to enjoy it better
The dense texture can feel dry or heavy to some, and its carbohydrate content may cause blood-sugar spikes if not paired wisely. To counteract this, always pair it with a protein (like eggs or nut butter) or healthy fat (like avocado) to slow digestion and stabilize blood sugar.
Key benefits
- High in dietary fiber for digestive health and satiety.
- Good source of plant-based protein (11.4g per 100g).
- Complex carbohydrates provide steady energy release.
- Toasting enhances texture and may reduce glycemic response slightly.
🍽️ Popular dishes
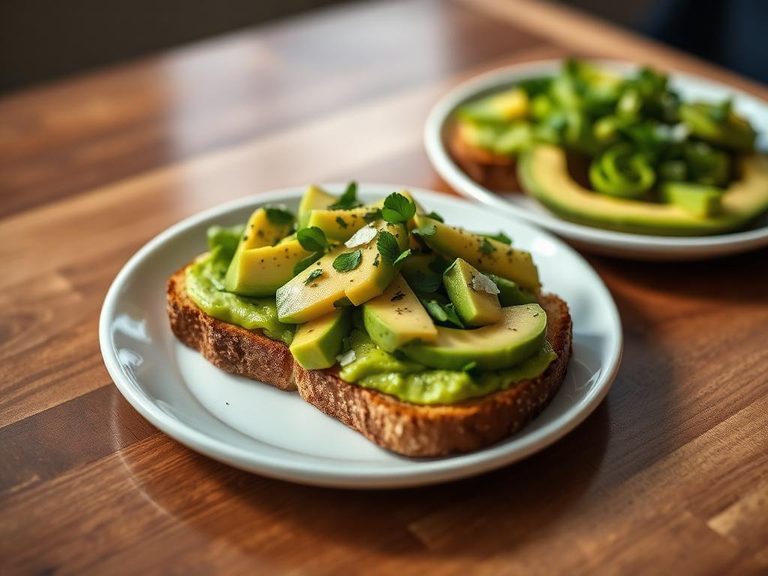
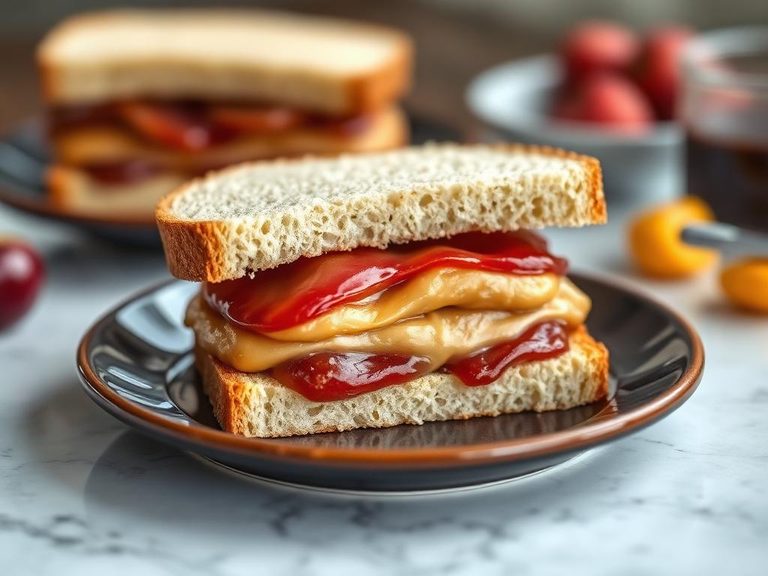

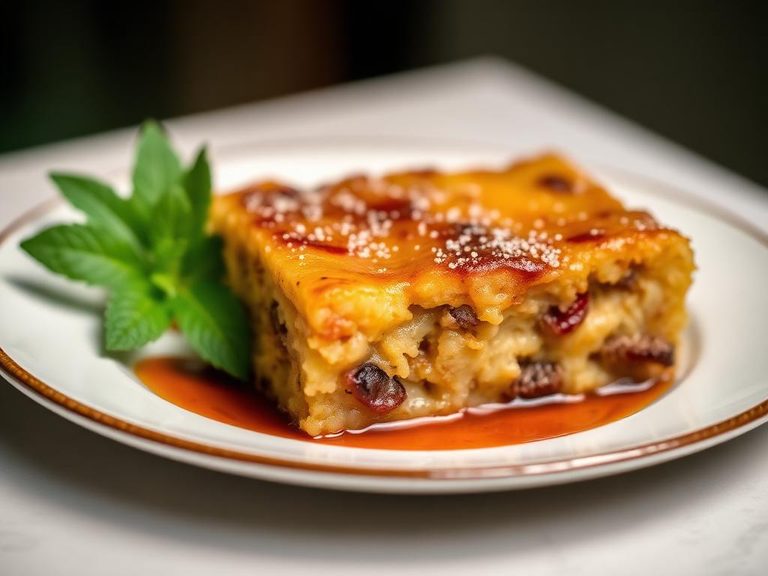

🌍 Where it's eaten
💡 Did you know?
The Maillard reaction, which creates the brown color and complex flavors during toasting, is the same chemical process that gives seared steak and roasted coffee their distinctive tastes.
Full nutrition (USDA data · scales with serving)
| Water | 29.3 g |
| Energy | 293 kcal |
| Protein | 11.4 g |
| Total lipid (fat) | 4.7 g |
| Carbohydrate, by difference | 51.6 g |
| Fiber, total dietary | 7.4 g |
| Total Sugars | 3.7 g |
| Calcium, Ca | 56.0 mg |
| Iron, Fe | 2.6 mg |
| Magnesium, Mg | 95.0 mg |
| Phosphorus, P | 267 mg |
| Potassium, K | 300 mg |
| Sodium, Na | 667 mg |
| Zinc, Zn | 2.4 mg |
| Copper, Cu | 0.31 mg |
| Selenium, Se | 16.3 ug |
| Vitamin C, total ascorbic acid | 0.00 mg |
| Thiamin | 0.34 mg |
| Riboflavin | 0.16 mg |
| Niacin | 3.9 mg |
| Vitamin B-6 | 0.19 mg |
| Folate, total | 42.0 ug |
| Folic acid | 0.00 ug |
| Folate, food | 42.0 ug |
| Folate, DFE | 42.0 ug |
| Choline, total | 23.6 mg |
| Vitamin B-12 | 0.07 ug |
| Vitamin B-12, added | 0.00 ug |
| Vitamin A, RAE | 22.0 ug |
| Retinol | 22.0 ug |
| Carotene, beta | 6.0 ug |
| Carotene, alpha | 0.00 ug |
| Cryptoxanthin, beta | 0.00 ug |
| Lycopene | 0.00 ug |
| Lutein + zeaxanthin | 126 ug |
| Vitamin E (alpha-tocopherol) | 0.56 mg |
| Vitamin E, added | 0.00 mg |
| Vitamin D (D2 + D3) | 0.30 ug |
| Vitamin K (phylloquinone) | 2.0 ug |
| Alcohol, ethyl | 0.00 g |
| Caffeine | 0.00 mg |
| Theobromine | 0.00 mg |
Fat & fatty acid profile (per 100g)
| Fatty acids, total saturated | 1.5 g |
| SFA 4:0 | 0.04 g |
| SFA 6:0 | 0.03 g |
| SFA 8:0 | 0.02 g |
| SFA 10:0 | 0.04 g |
| SFA 12:0 | 0.04 g |
| SFA 14:0 | 0.14 g |
| SFA 16:0 | 0.84 g |
| SFA 18:0 | 0.30 g |
| Fatty acids, total monounsaturated | 1.1 g |
| MUFA 16:1 | 0.05 g |
| MUFA 18:1 | 1.00 g |
| MUFA 20:1 | 0.01 g |
| MUFA 22:1 | 0.00 g |
| Fatty acids, total polyunsaturated | 1.2 g |
| PUFA 18:2 | 1.1 g |
| PUFA 18:3 | 0.08 g |
| PUFA 18:4 | 0.00 g |
| PUFA 20:4 | 0.00 g |
| PUFA 20:5 n-3 (EPA) | 0.00 g |
| PUFA 22:5 n-3 (DPA) | 0.00 g |
| PUFA 22:6 n-3 (DHA) | 0.00 g |
| Cholesterol | 5.0 mg |
Amino acid profile (per 100g)
Estimated from Bread, salvadoran sweet cheese (quesadilla salvadorena) — USDA does not publish this profile for Bread.
| Tryptophan | 0.07 g |
| Threonine | 0.21 g |
| Isoleucine | 0.30 g |
| Leucine | 0.65 g |
| Lysine | 0.50 g |
| Methionine | 0.28 g |
| Cystine | 0.06 g |
| Phenylalanine | 0.37 g |
| Tyrosine | 0.23 g |
| Valine | 0.43 g |
| Arginine | 0.25 g |
| Histidine | 0.15 g |
| Alanine | 0.36 g |
| Aspartic acid | 0.59 g |
| Glutamic acid | 1.3 g |
| Glycine | 0.20 g |
| Proline | 0.83 g |
| Serine | 0.45 g |
| Hydroxyproline | 0.00 g |
FAQ
Is toasted whole wheat bread healthier than untoasted?
Toasting doesn't significantly change the nutritional profile but can reduce the glycemic index slightly. The main benefit is textural and flavor enhancement.
Why does toasted bread sometimes feel drier than fresh?
Toasting evaporates moisture from the bread's surface, creating a crisp texture. The interior remains chewier, but the overall mouthfeel can be drier.
Can I freeze whole wheat bread to keep it fresh longer?
Yes, freezing is an excellent way to preserve freshness. Slice it first, then freeze in a sealed bag. Toast directly from frozen for best results.
Nutrient density (calculated · NRF9.3)
Nutrient Rich Foods index: beneficial nutrients (protein, fiber, vitamins, minerals) minus saturated fat, added sugar & sodium, per 100 kcal.
NRF9.3 index — Fulgoni, Keast & Drewnowski, 2009. Computed from USDA nutrients.
Weight-loss friendliness (composite index)
Energy density 2.93 kcal/g · 16% calories from protein · 7.4 g fiber · 3.7 g sugar per 100 g.
Composite of energy density (Rolls et al., 1999), protein & fiber satiety, minus sugar. A calculated heuristic — ranks satiety-per-calorie, not a clinical measure.
Dietary load (calculated from USDA values)
Potential renal acid load. Positive = acid-forming, negative = alkaline-forming.
Sodium-to-potassium ratio: 2.22 (lower is better — aim for ≤ 1)
Sodium:potassium per WHO potassium guidance. Computed from USDA nutrients.