

Cereal or granola bar, peanuts , oats, sugar, wheat germ
Common food

Photo: Wikipedia
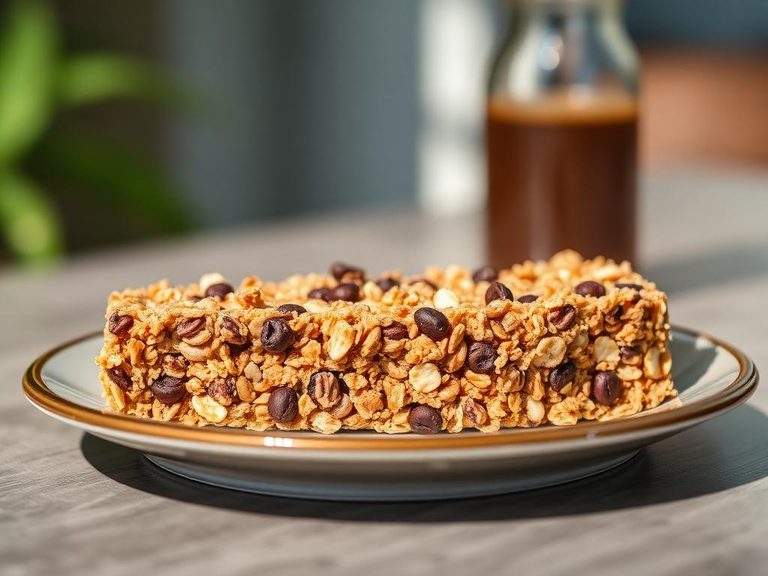
A crunchy, chewy bar where the earthy sweetness of oats and wheat germ meets the salty, roasted punch of peanuts. It's a dense, portable energy source with a satisfying texture that balances a wholesome grain base with a noticeable sugar content.
Calorie split: 8% protein · 54% carbs · 37% fat
↓ Full nutrition💚 Why it's loved
People love it for its perfect balance of sweet and salty, and the satisfying crunch that makes it feel like a treat rather than a health food. It's the ultimate grab-and-go snack for busy mornings, hikes, or a quick desk drawer pick-me-up.
⚠️ Watch-outs & how to enjoy it better
The high sugar content (nearly 29g per 100g) can lead to a rapid blood-sugar spike, especially if eaten alone. As a common allergen, peanuts are a serious concern for many. To counteract, pair it with a source of protein or fat (like Greek yogurt or a hard-boiled egg) and practice strict portion control, sticking to a single bar.
Key benefits
- Provides quick and sustained energy from complex carbs and natural fats.
- Good source of plant-based protein from peanuts and oats.
- Contains dietary fiber from oats, wheat germ, and peanuts.
- Offers micronutrients like magnesium, iron, and B vitamins from whole grains.
- Highly portable and shelf-stable for on-the-go nutrition.
🍽️ Popular dishes

🌍 Where it's eaten
💡 Did you know?
The first commercial granola bar was invented in 1975 by a General Mills scientist who wanted to create a convenient, non-messy version of their popular Nature Valley Granola Cereal.
Full nutrition (USDA data · scales with serving)
| Water | 3.9 g |
| Energy | 471 kcal |
| Protein | 10.1 g |
| Total lipid (fat) | 19.8 g |
| Carbohydrate, by difference | 64.4 g |
| Fiber, total dietary | 5.3 g |
| Total Sugars | 28.6 g |
| Calcium, Ca | 61.0 mg |
| Iron, Fe | 3.0 mg |
| Magnesium, Mg | 97.0 mg |
| Phosphorus, P | 277 mg |
| Potassium, K | 336 mg |
| Sodium, Na | 294 mg |
| Zinc, Zn | 2.0 mg |
| Copper, Cu | 0.39 mg |
| Selenium, Se | 16.2 ug |
| Vitamin C, total ascorbic acid | 0.90 mg |
| Thiamin | 0.26 mg |
| Riboflavin | 0.12 mg |
| Niacin | 1.6 mg |
| Vitamin B-6 | 0.09 mg |
| Folate, total | 23.0 ug |
| Folic acid | 0.00 ug |
| Folate, food | 23.0 ug |
| Folate, DFE | 23.0 ug |
| Choline, total | 22.0 mg |
| Vitamin B-12 | 0.00 ug |
| Vitamin B-12, added | 0.00 ug |
| Vitamin A, RAE | 2.0 ug |
| Retinol | 0.00 ug |
| Carotene, beta | 17.0 ug |
| Carotene, alpha | 6.0 ug |
| Cryptoxanthin, beta | 0.00 ug |
| Lycopene | 0.00 ug |
| Lutein + zeaxanthin | 189 ug |
| Vitamin E (alpha-tocopherol) | 2.1 mg |
| Vitamin E, added | 0.00 mg |
| Vitamin D (D2 + D3) | 0.00 ug |
| Vitamin K (phylloquinone) | 14.6 ug |
| Alcohol, ethyl | 0.00 g |
| Caffeine | 0.00 mg |
| Theobromine | 0.00 mg |
Fat & fatty acid profile (per 100g)
| Fatty acids, total saturated | 2.4 g |
| SFA 4:0 | 0.00 g |
| SFA 6:0 | 0.00 g |
| SFA 8:0 | 0.00 g |
| SFA 10:0 | 0.00 g |
| SFA 12:0 | 0.01 g |
| SFA 14:0 | 0.01 g |
| SFA 16:0 | 1.5 g |
| SFA 18:0 | 0.76 g |
| Fatty acids, total monounsaturated | 4.4 g |
| MUFA 16:1 | 0.01 g |
| MUFA 18:1 | 4.4 g |
| MUFA 20:1 | 0.13 g |
| MUFA 22:1 | 0.00 g |
| Fatty acids, total polyunsaturated | 12.1 g |
| PUFA 18:2 | 12.0 g |
| PUFA 18:3 | 0.06 g |
| PUFA 18:4 | 0.00 g |
| PUFA 20:4 | 0.00 g |
| PUFA 20:5 n-3 (EPA) | 0.00 g |
| PUFA 22:5 n-3 (DPA) | 0.00 g |
| PUFA 22:6 n-3 (DHA) | 0.00 g |
| Cholesterol | 0.00 mg |
Amino acid profile (per 100g)
Estimated from Cereals ready-to-eat, granola, homemade — USDA does not publish this profile for Cereal or granola bar.
| Tryptophan | 0.19 g |
| Threonine | 0.48 g |
| Isoleucine | 0.55 g |
| Leucine | 0.98 g |
| Lysine | 0.63 g |
| Methionine | 0.23 g |
| Cystine | 0.30 g |
| Phenylalanine | 0.67 g |
| Tyrosine | 0.38 g |
| Valine | 0.70 g |
| Arginine | 1.3 g |
| Histidine | 0.35 g |
| Alanine | 0.69 g |
| Aspartic acid | 1.4 g |
| Glutamic acid | 3.1 g |
| Glycine | 0.81 g |
| Proline | 0.66 g |
| Serine | 0.67 g |
| Hydroxyproline | 0.00 g |
FAQ
Is this a healthy breakfast option?
It can be part of a balanced breakfast, but its high sugar content means it's best paired with protein (like eggs or yogurt) and fiber (like fruit) to prevent an energy crash.
Why is wheat germ included?
Wheat germ is the nutrient-dense embryo of the wheat kernel. It's added for its nutty flavor, crunchy texture, and boost of protein, healthy fats, and vitamins like folate.
How does it differ from a protein bar?
This bar is primarily carbohydrate-based from oats and sugar, with moderate protein. A protein bar is formulated to have a much higher protein-to-carb ratio, often using protein isolates.
Nutrient density (calculated · NRF9.3)
Nutrient Rich Foods index: beneficial nutrients (protein, fiber, vitamins, minerals) minus saturated fat, added sugar & sodium, per 100 kcal.
NRF9.3 index — Fulgoni, Keast & Drewnowski, 2009. Computed from USDA nutrients.
Weight-loss friendliness (composite index)
Energy density 4.71 kcal/g · 9% calories from protein · 5.3 g fiber · 28.6 g sugar per 100 g.
Composite of energy density (Rolls et al., 1999), protein & fiber satiety, minus sugar. A calculated heuristic — ranks satiety-per-calorie, not a clinical measure.
Dietary load (calculated from USDA values)
Potential renal acid load. Positive = acid-forming, negative = alkaline-forming.
Sodium-to-potassium ratio: 0.88 (lower is better — aim for ≤ 1)
Sodium:potassium per WHO potassium guidance. Computed from USDA nutrients.