

Snacks, corn cakes
Whole food · Snacks

Photo: Wikipedia
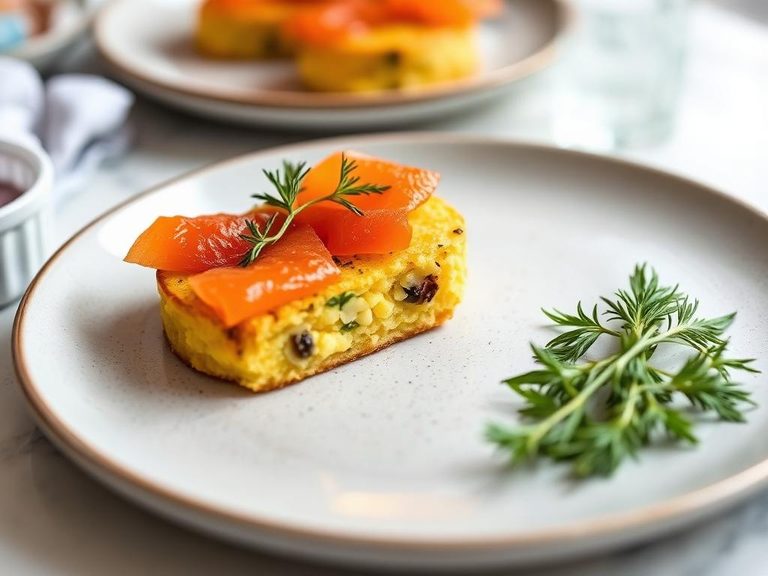
Corn cakes are light, crispy wafers made from cornmeal, offering a satisfying crunch with a subtly sweet, toasty corn flavor. Their nutritional profile is dominated by carbohydrates, providing a quick source of energy, with minimal fat and a modest amount of protein.
Calorie split: 8% protein · 86% carbs · 6% fat
↓ Full nutrition💚 Why it's loved
People love corn cakes for their satisfying crunch and neutral, slightly sweet corn flavor that pairs perfectly with dips, cheeses, or spreads. They are a beloved staple in many cultures, from a simple accompaniment to soups to a canvas for elaborate toppings.
⚠️ Watch-outs & how to enjoy it better
Their high carbohydrate and sugar content can lead to rapid blood sugar spikes, making them a poor choice for individuals managing diabetes or insulin resistance. To counteract this, pair them with a source of protein (like cheese or hummus) or healthy fat (like avocado) to slow digestion, and practice strict portion control.
Key benefits
- Provides a quick energy boost from complex carbohydrates.
- Low in fat, making it a lighter snack option.
- Contains some dietary fiber from the cornmeal.
- Gluten-free if made with pure cornmeal.
- Versatile base for both sweet and savory toppings.
🍽️ Popular dishes
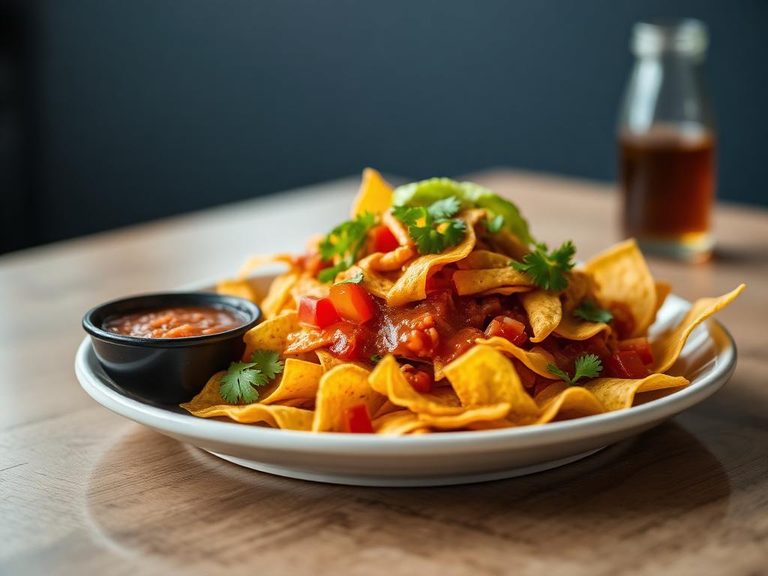

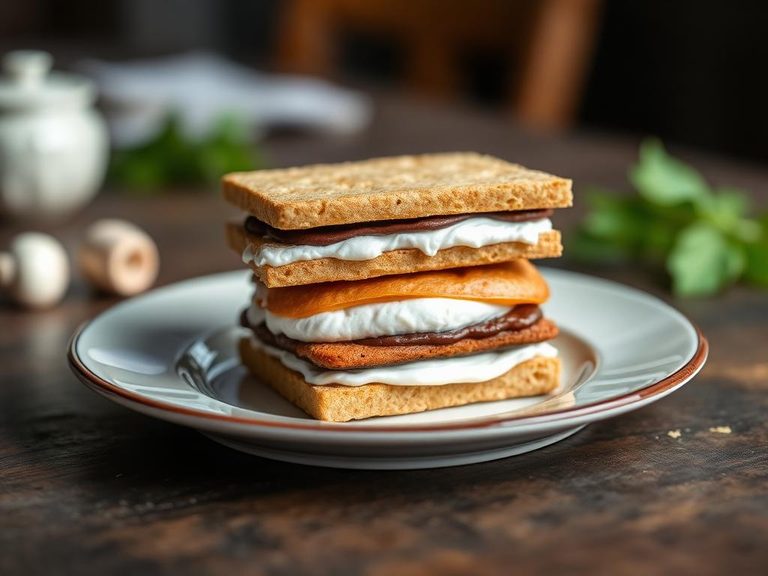
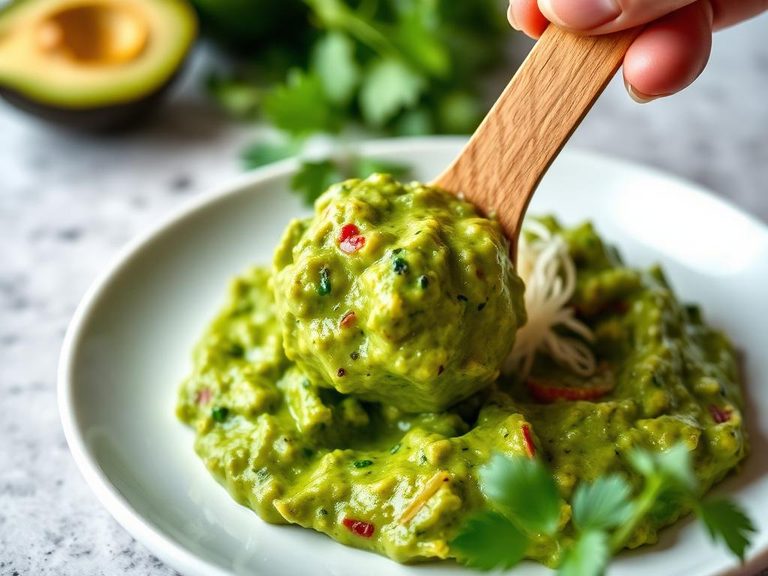
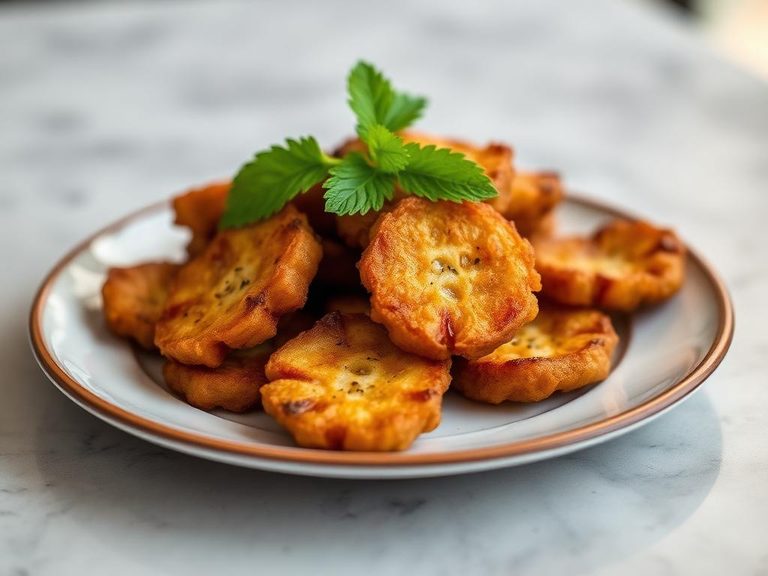
🌍 Where it's eaten
💡 Did you know?
The process of nixtamalization, where corn is treated with an alkaline solution, was a revolutionary Mesoamerican discovery that unlocked the nutritional value of corn by making niacin bioavailable and is the foundation for masa dough used in tortillas and tamales.
Full nutrition (USDA data · scales with serving)
| Water | 4.6 g |
| Energy | 387 kcal |
| Energy | 1619 kj |
| Protein | 8.1 g |
| Total lipid (fat) | 2.4 g |
| Ash | 1.5 g |
| Carbohydrate, by difference | 83.4 g |
| Fiber, total dietary | 1.9 g |
| Total Sugars | 23.5 g |
| Calcium, Ca | 19.0 mg |
| Iron, Fe | 1.4 mg |
| Magnesium, Mg | 114 mg |
| Phosphorus, P | 157 mg |
| Potassium, K | 157 mg |
| Sodium, Na | 488 mg |
| Zinc, Zn | 2.0 mg |
| Copper, Cu | 0.42 mg |
| Manganese, Mn | 1.8 mg |
| Selenium, Se | 9.9 ug |
| Vitamin C, total ascorbic acid | 0.00 mg |
| Thiamin | 0.25 mg |
| Riboflavin | 0.05 mg |
| Niacin | 5.2 mg |
| Pantothenic acid | 0.83 mg |
| Vitamin B-6 | 0.14 mg |
| Folate, total | 19.0 ug |
| Folic acid | 0.00 ug |
| Folate, food | 19.0 ug |
| Folate, DFE | 19.0 ug |
| Vitamin B-12 | 0.00 ug |
| Vitamin A, RAE | 70.0 ug |
| Retinol | 69.0 ug |
| Carotene, beta | 5.0 ug |
| Carotene, alpha | 0.00 ug |
| Cryptoxanthin, beta | 4.0 ug |
| Vitamin A, IU | 242 iu |
| Lycopene | 0.00 ug |
| Lutein + zeaxanthin | 0.00 ug |
| Tocotrienol, alpha | 0.00 mg |
| Vitamin K (phylloquinone) | 0.00 ug |
| Alcohol, ethyl | 0.00 g |
| Caffeine | 0.00 mg |
| Theobromine | 0.00 mg |
Fat & fatty acid profile (per 100g)
| Fatty acids, total saturated | 0.42 g |
| SFA 4:0 | 0.00 g |
| SFA 6:0 | 0.00 g |
| SFA 8:0 | 0.00 g |
| SFA 10:0 | 0.00 g |
| SFA 12:0 | 0.00 g |
| SFA 14:0 | 0.01 g |
| SFA 16:0 | 0.36 g |
| SFA 18:0 | 0.04 g |
| Fatty acids, total monounsaturated | 0.76 g |
| MUFA 16:1 | 0.01 g |
| MUFA 18:1 | 0.76 g |
| MUFA 20:1 | 0.00 g |
| MUFA 22:1 | 0.00 g |
| Fatty acids, total polyunsaturated | 0.93 g |
| PUFA 18:2 | 0.89 g |
| PUFA 18:3 | 0.03 g |
| PUFA 18:4 | 0.00 g |
| PUFA 20:4 | 0.00 g |
| PUFA 20:5 n-3 (EPA) | 0.00 g |
| PUFA 22:5 n-3 (DPA) | 0.00 g |
| PUFA 22:6 n-3 (DHA) | 0.00 g |
| Cholesterol | 0.00 mg |
Amino acid profile (per 100g)
| Tryptophan | 0.08 g |
| Threonine | 0.30 g |
| Isoleucine | 0.32 g |
| Leucine | 0.84 g |
| Lysine | 0.27 g |
| Methionine | 0.18 g |
| Cystine | 0.12 g |
| Phenylalanine | 0.41 g |
| Tyrosine | 0.32 g |
| Valine | 0.44 g |
| Arginine | 0.51 g |
| Histidine | 0.23 g |
| Alanine | 0.54 g |
| Aspartic acid | 0.66 g |
| Glutamic acid | 1.6 g |
| Glycine | 0.36 g |
| Proline | 0.55 g |
| Serine | 0.40 g |
FAQ
Are corn cakes the same as tortillas?
No. Corn cakes are typically leavened and baked or fried to be crispy and dry, like a cracker. Tortillas are unleavened, soft, pliable flatbreads made from masa dough.
Can I make corn cakes at home?
Yes. A simple recipe involves mixing cornmeal, a little flour, salt, water or milk, and a touch of sugar, then forming thin patties and pan-frying them in a small amount of oil until crispy.
Why are corn cakes so high in sugar?
Many commercial brands add sugar or sweeteners to enhance flavor and browning. The high carbohydrate content (83.4g per 100g) also includes naturally occurring sugars from the corn itself.
Nutrient density (calculated · NRF9.3)
Nutrient Rich Foods index: beneficial nutrients (protein, fiber, vitamins, minerals) minus saturated fat, added sugar & sodium, per 100 kcal.
NRF9.3 index — Fulgoni, Keast & Drewnowski, 2009. Computed from USDA nutrients.
Weight-loss friendliness (composite index)
Energy density 3.87 kcal/g · 8% calories from protein · 1.9 g fiber · 23.5 g sugar per 100 g.
Composite of energy density (Rolls et al., 1999), protein & fiber satiety, minus sugar. A calculated heuristic — ranks satiety-per-calorie, not a clinical measure.
Dietary load (calculated from USDA values)
Potential renal acid load. Positive = acid-forming, negative = alkaline-forming.
Sodium-to-potassium ratio: 3.11 (lower is better — aim for ≤ 1)
Sodium:potassium per WHO potassium guidance. Computed from USDA nutrients.