

Rice, white, with peas, fat added
Common food

Photo: Wikipedia
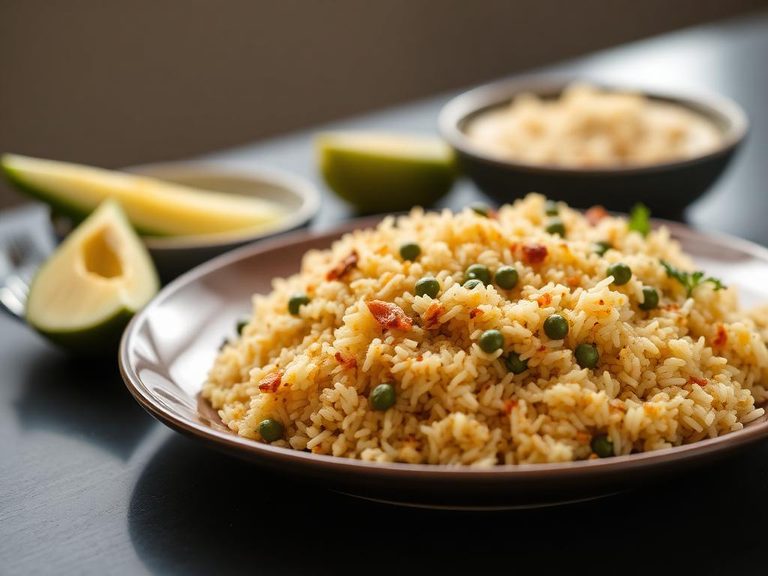
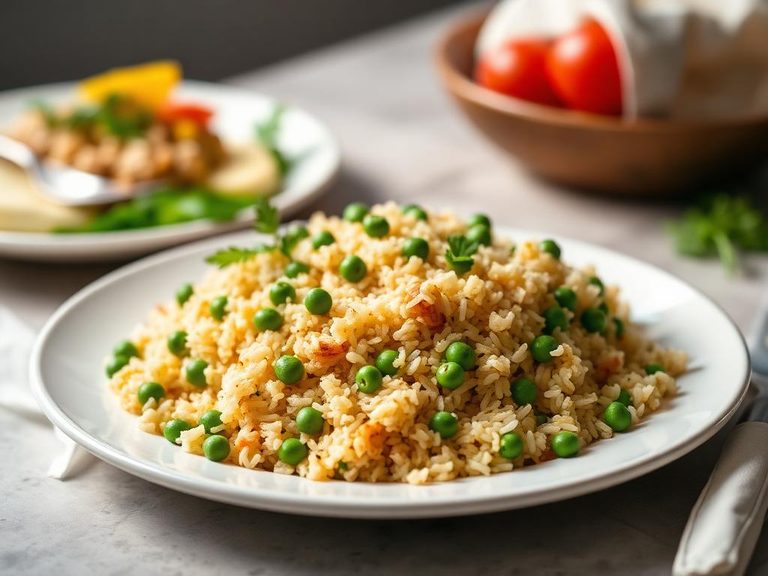
This is a comforting, savory side dish of fluffy white rice studded with sweet green peas and enriched with a touch of fat for richness. The texture is tender and slightly sticky, with the peas providing a pleasant pop of freshness against the mild, starchy backdrop. At 133 kcal per 100g, it offers a balanced energy source with a modest protein boost from the legumes.
Calorie split: 10% protein · 73% carbs · 17% fat
↓ Full nutrition💚 Why it's loved
People love it for its comforting, nostalgic simplicity and the way the sweet peas brighten the mild rice. It's a beloved, versatile staple that pairs effortlessly with countless main dishes, from curries to grilled meats.
⚠️ Watch-outs & how to enjoy it better
The white rice base can cause rapid blood-sugar spikes, especially for those with insulin sensitivity. To counteract this, pair it with a significant source of protein (like lentils or chicken) or non-starchy vegetables, and practice portion control. The added fat, while flavorful, increases calorie density.
Key benefits
- Provides quick energy from carbohydrates.
- Peas add plant-based protein and fiber.
- The added fat enhances satiety and nutrient absorption.
- Simple, versatile base for many cuisines.
- Contains some B vitamins and minerals from the peas.
🍽️ Popular dishes
🌍 Where it's eaten
💡 Did you know?
The classic British dish 'Mushy Peas' is traditionally served with fish and chips, but the combination of rice and peas is so fundamental it appears in cuisines from the Andes to the Alps.
Full nutrition (USDA data · scales with serving)
| Water | 69.4 g |
| Energy | 133 kcal |
| Protein | 3.2 g |
| Total lipid (fat) | 2.4 g |
| Carbohydrate, by difference | 24.0 g |
| Fiber, total dietary | 1.4 g |
| Total Sugars | 1.1 g |
| Calcium, Ca | 13.0 mg |
| Iron, Fe | 1.3 mg |
| Magnesium, Mg | 14.0 mg |
| Phosphorus, P | 50.0 mg |
| Potassium, K | 52.0 mg |
| Sodium, Na | 197 mg |
| Zinc, Zn | 0.52 mg |
| Copper, Cu | 0.08 mg |
| Selenium, Se | 5.7 ug |
| Vitamin C, total ascorbic acid | 2.4 mg |
| Thiamin | 0.19 mg |
| Riboflavin | 0.03 mg |
| Niacin | 1.4 mg |
| Vitamin B-6 | 0.10 mg |
| Folate, total | 57.0 ug |
| Folic acid | 40.0 ug |
| Folate, food | 17.0 ug |
| Folate, DFE | 85.0 ug |
| Choline, total | 8.3 mg |
| Vitamin B-12 | 0.00 ug |
| Vitamin B-12, added | 0.00 ug |
| Vitamin A, RAE | 26.0 ug |
| Retinol | 0.00 ug |
| Carotene, beta | 306 ug |
| Carotene, alpha | 5.0 ug |
| Cryptoxanthin, beta | 0.00 ug |
| Lycopene | 0.00 ug |
| Lutein + zeaxanthin | 587 ug |
| Vitamin E (alpha-tocopherol) | 0.45 mg |
| Vitamin E, added | 0.00 mg |
| Vitamin D (D2 + D3) | 0.00 ug |
| Vitamin K (phylloquinone) | 8.0 ug |
| Alcohol, ethyl | 0.00 g |
| Caffeine | 0.00 mg |
| Theobromine | 0.00 mg |
Fat & fatty acid profile (per 100g)
| Fatty acids, total saturated | 0.36 g |
| SFA 4:0 | 0.00 g |
| SFA 6:0 | 0.00 g |
| SFA 8:0 | 0.00 g |
| SFA 10:0 | 0.00 g |
| SFA 12:0 | 0.00 g |
| SFA 14:0 | 0.00 g |
| SFA 16:0 | 0.27 g |
| SFA 18:0 | 0.07 g |
| Fatty acids, total monounsaturated | 0.98 g |
| MUFA 16:1 | 0.01 g |
| MUFA 18:1 | 0.96 g |
| MUFA 20:1 | 0.01 g |
| MUFA 22:1 | 0.00 g |
| Fatty acids, total polyunsaturated | 0.91 g |
| PUFA 18:2 | 0.80 g |
| PUFA 18:3 | 0.11 g |
| PUFA 18:4 | 0.00 g |
| PUFA 20:4 | 0.00 g |
| PUFA 20:5 n-3 (EPA) | 0.00 g |
| PUFA 22:5 n-3 (DPA) | 0.00 g |
| PUFA 22:6 n-3 (DHA) | 0.00 g |
| Cholesterol | 0.00 mg |
Amino acid profile (per 100g)
Estimated from Snacks, rice cakes, brown rice, sesame seed — USDA does not publish this profile for Rice.
| Tryptophan | 0.10 g |
| Threonine | 0.28 g |
| Isoleucine | 0.32 g |
| Leucine | 0.63 g |
| Lysine | 0.29 g |
| Methionine | 0.17 g |
| Cystine | 0.09 g |
| Phenylalanine | 0.39 g |
| Tyrosine | 0.29 g |
| Valine | 0.44 g |
| Arginine | 0.59 g |
| Histidine | 0.19 g |
| Alanine | 0.44 g |
| Aspartic acid | 0.71 g |
| Glutamic acid | 1.6 g |
| Glycine | 0.38 g |
| Proline | 0.35 g |
| Serine | 0.39 g |
FAQ
Is this dish gluten-free?
The base ingredients (rice, peas, fat) are naturally gluten-free. However, always check for cross-contamination if prepared commercially or with added seasonings.
How can I make it more nutritious?
Use brown rice for more fiber and nutrients, add diced onions and garlic for flavor and antioxidants, and consider mixing in other vegetables or a protein source like chickpeas.
Why is fat added?
Fat (like butter, ghee, or oil) is used to sauté aromatics, prevent sticking, and add richness and flavor, making the dish more satisfying and helping to carry fat-soluble vitamins.
Nutrient density (calculated · NRF9.3)
Nutrient Rich Foods index: beneficial nutrients (protein, fiber, vitamins, minerals) minus saturated fat, added sugar & sodium, per 100 kcal.
NRF9.3 index — Fulgoni, Keast & Drewnowski, 2009. Computed from USDA nutrients.
Weight-loss friendliness (composite index)
Energy density 1.33 kcal/g · 10% calories from protein · 1.4 g fiber · 1.1 g sugar per 100 g.
Composite of energy density (Rolls et al., 1999), protein & fiber satiety, minus sugar. A calculated heuristic — ranks satiety-per-calorie, not a clinical measure.
Dietary load (calculated from USDA values)
Potential renal acid load. Positive = acid-forming, negative = alkaline-forming.
Sodium-to-potassium ratio: 3.79 (lower is better — aim for ≤ 1)
Sodium:potassium per WHO potassium guidance. Computed from USDA nutrients.