

Rice, brown, cooked, as ingredient
Common food

Photo: Wikipedia
Cooked brown rice is a hearty, whole-grain staple with a satisfying, chewy texture and a mild, nutty flavor that sets it apart from its polished white counterpart. Its intact bran layer gives it a light brown hue and a more robust mouthfeel. Nutritionally, it's a solid source of complex carbohydrates and provides a modest amount of plant-based protein.
Calorie split: 8% protein · 84% carbs · 8% fat
↓ Full nutrition💚 Why it's loved
People love it for its earthy, nutty taste and chewy texture that adds substance to meals. It's incredibly versatile, serving as a reliable base for everything from stir-fries and grain bowls to pilafs and stuffed vegetables.
⚠️ Watch-outs & how to enjoy it better
Some find its texture too chewy or its cooking time longer than white rice. Its bran layer contains phytic acid, which can slightly reduce mineral absorption; pairing it with vitamin C-rich foods (like a squeeze of lemon or a side of vegetables) can help counteract this.
Key benefits
- High in dietary fiber for digestive health
- Contains magnesium, phosphorus, and B vitamins
- Provides sustained energy due to complex carbs
- Whole grain linked to reduced risk of chronic diseases
- Naturally gluten-free
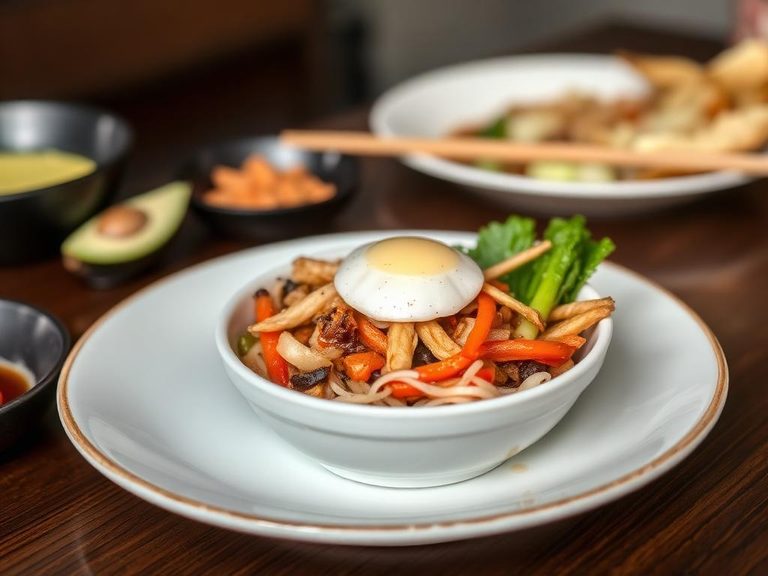
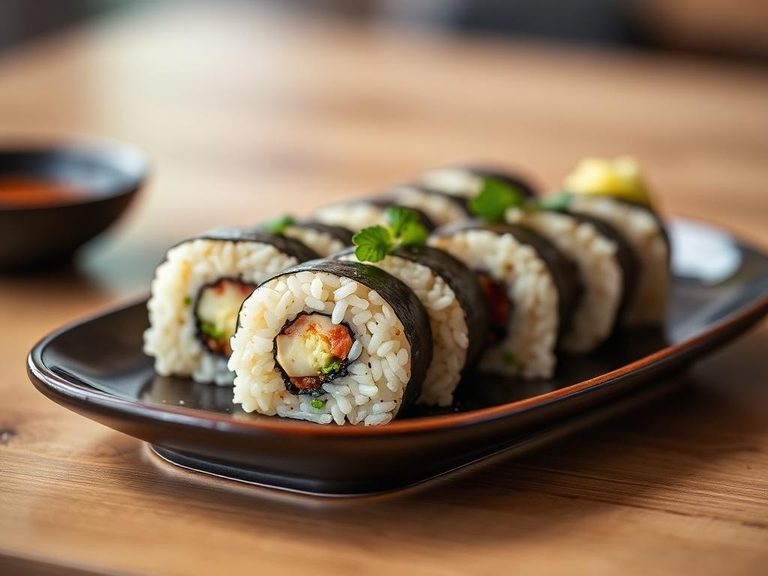
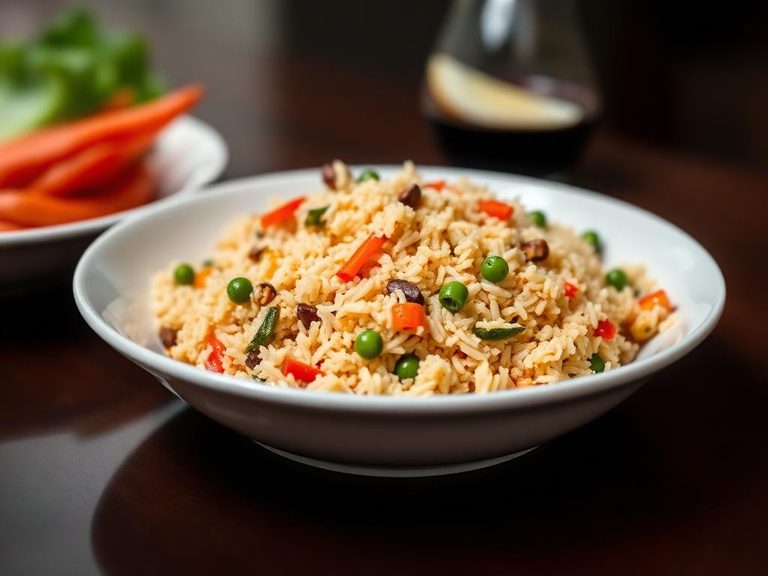
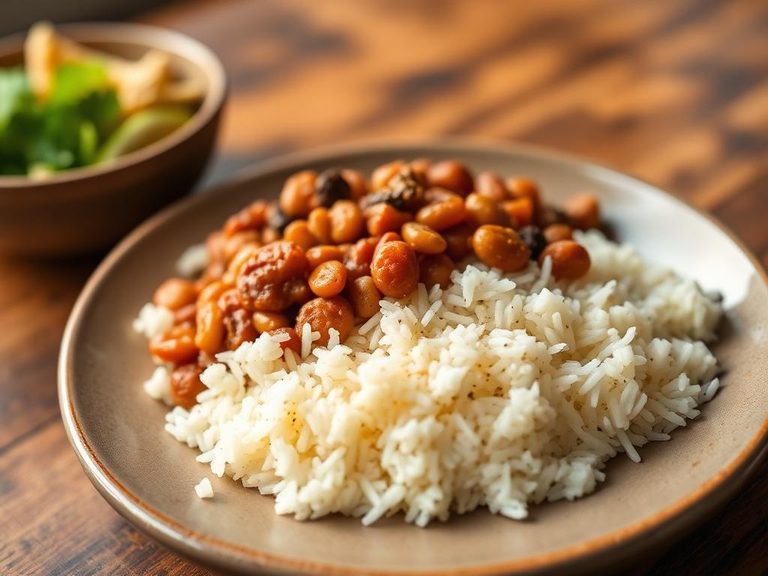
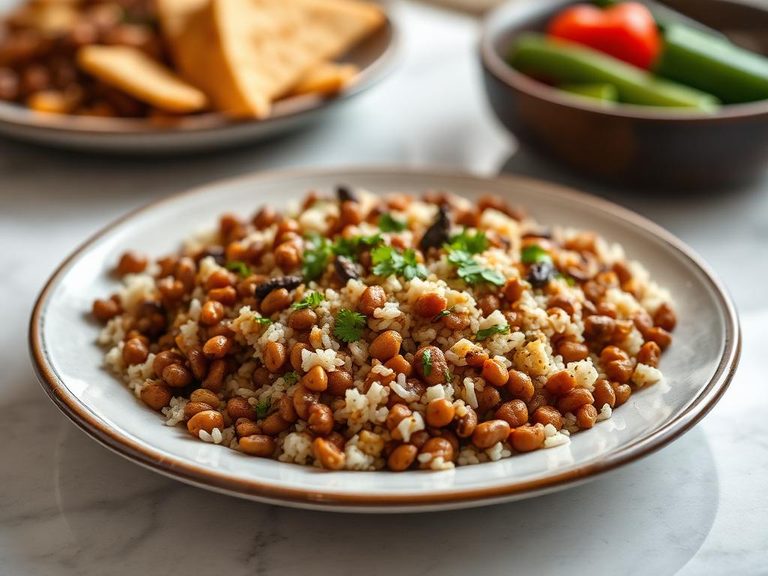
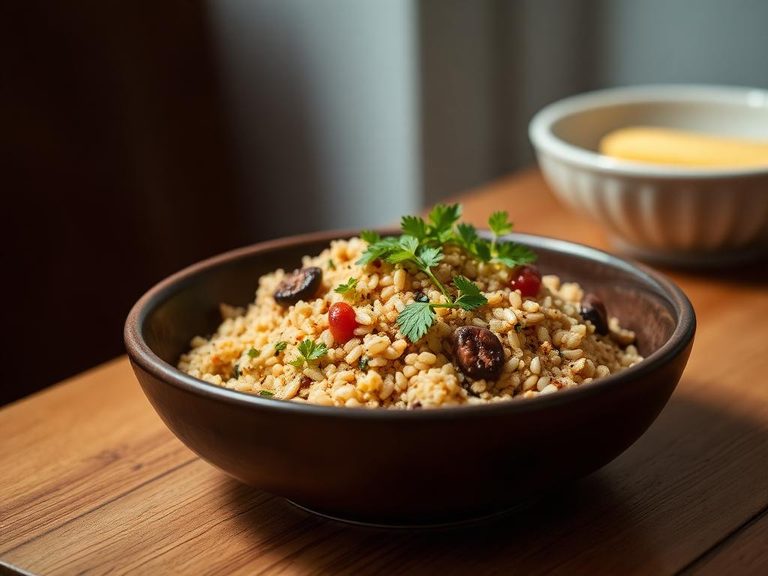
🍽️ Popular dishes
🌍 Where it's eaten
💡 Did you know?
Brown rice is technically a seed and is considered a whole grain because it retains its fibrous bran layer and nutrient-rich germ, which are removed to make white rice.
Full nutrition (USDA data · scales with serving)
| Water | 70.0 g |
| Energy | 124 kcal |
| Protein | 2.5 g |
| Total lipid (fat) | 1.1 g |
| Carbohydrate, by difference | 25.9 g |
| Fiber, total dietary | 1.0 g |
| Total Sugars | 0.22 g |
| Calcium, Ca | 5.0 mg |
| Iron, Fe | 0.40 mg |
| Magnesium, Mg | 40.0 mg |
| Phosphorus, P | 97.0 mg |
| Potassium, K | 80.0 mg |
| Sodium, Na | 3.0 mg |
| Zinc, Zn | 0.63 mg |
| Copper, Cu | 0.09 mg |
| Selenium, Se | 5.0 ug |
| Vitamin C, total ascorbic acid | 0.00 mg |
| Thiamin | 0.09 mg |
| Riboflavin | 0.03 mg |
| Niacin | 2.1 mg |
| Vitamin B-6 | 0.05 mg |
| Folate, total | 5.0 ug |
| Folic acid | 0.00 ug |
| Folate, food | 5.0 ug |
| Folate, DFE | 5.0 ug |
| Choline, total | 7.3 mg |
| Vitamin B-12 | 0.00 ug |
| Vitamin B-12, added | 0.00 ug |
| Vitamin A, RAE | 0.00 ug |
| Retinol | 0.00 ug |
| Carotene, beta | 0.00 ug |
| Carotene, alpha | 0.00 ug |
| Cryptoxanthin, beta | 0.00 ug |
| Lycopene | 0.00 ug |
| Lutein + zeaxanthin | 0.00 ug |
| Vitamin E (alpha-tocopherol) | 0.20 mg |
| Vitamin E, added | 0.00 mg |
| Vitamin D (D2 + D3) | 0.00 ug |
| Vitamin K (phylloquinone) | 0.20 ug |
| Alcohol, ethyl | 0.00 g |
| Caffeine | 0.00 mg |
| Theobromine | 0.00 mg |
Fat & fatty acid profile (per 100g)
| Fatty acids, total saturated | 0.20 g |
| SFA 4:0 | 0.00 g |
| SFA 6:0 | 0.00 g |
| SFA 8:0 | 0.00 g |
| SFA 10:0 | 0.01 g |
| SFA 12:0 | 0.00 g |
| SFA 14:0 | 0.01 g |
| SFA 16:0 | 0.15 g |
| SFA 18:0 | 0.02 g |
| Fatty acids, total monounsaturated | 0.36 g |
| MUFA 16:1 | 0.00 g |
| MUFA 18:1 | 0.35 g |
| MUFA 20:1 | 0.00 g |
| MUFA 22:1 | 0.00 g |
| Fatty acids, total polyunsaturated | 0.34 g |
| PUFA 18:2 | 0.33 g |
| PUFA 18:3 | 0.01 g |
| PUFA 18:4 | 0.00 g |
| PUFA 20:4 | 0.00 g |
| PUFA 20:5 n-3 (EPA) | 0.00 g |
| PUFA 22:5 n-3 (DPA) | 0.00 g |
| PUFA 22:6 n-3 (DHA) | 0.00 g |
| Cholesterol | 0.00 mg |
Amino acid profile (per 100g)
Estimated from Snacks, rice cakes, brown rice, sesame seed — USDA does not publish this profile for Rice.
| Tryptophan | 0.10 g |
| Threonine | 0.28 g |
| Isoleucine | 0.32 g |
| Leucine | 0.63 g |
| Lysine | 0.29 g |
| Methionine | 0.17 g |
| Cystine | 0.09 g |
| Phenylalanine | 0.39 g |
| Tyrosine | 0.29 g |
| Valine | 0.44 g |
| Arginine | 0.59 g |
| Histidine | 0.19 g |
| Alanine | 0.44 g |
| Aspartic acid | 0.71 g |
| Glutamic acid | 1.6 g |
| Glycine | 0.38 g |
| Proline | 0.35 g |
| Serine | 0.39 g |
FAQ
How does brown rice differ nutritionally from white rice?
Brown rice is a whole grain, retaining its bran and germ, which gives it more fiber, vitamins (like B vitamins), and minerals (like magnesium) compared to refined white rice, which has had these nutrient-rich layers removed.
Why does brown rice take longer to cook than white rice?
The intact bran layer on brown rice acts as a barrier, slowing water absorption. This typically requires a longer simmering time (about 40-50 minutes) compared to white rice (15-20 minutes).
Is brown rice safe for people with celiac disease?
Yes, brown rice is naturally gluten-free and is a safe and nutritious grain option for individuals with celiac disease or gluten sensitivity, provided it is not cross-contaminated during processing.
Nutrient density (calculated · NRF9.3)
Nutrient Rich Foods index: beneficial nutrients (protein, fiber, vitamins, minerals) minus saturated fat, added sugar & sodium, per 100 kcal.
NRF9.3 index — Fulgoni, Keast & Drewnowski, 2009. Computed from USDA nutrients.
Weight-loss friendliness (composite index)
Energy density 1.24 kcal/g · 8% calories from protein · 1.0 g fiber · 0.2 g sugar per 100 g.
Composite of energy density (Rolls et al., 1999), protein & fiber satiety, minus sugar. A calculated heuristic — ranks satiety-per-calorie, not a clinical measure.
Dietary load (calculated from USDA values)
Potential renal acid load. Positive = acid-forming, negative = alkaline-forming.
Sodium-to-potassium ratio: 0.04 (lower is better — aim for ≤ 1)
Sodium:potassium per WHO potassium guidance. Computed from USDA nutrients.