

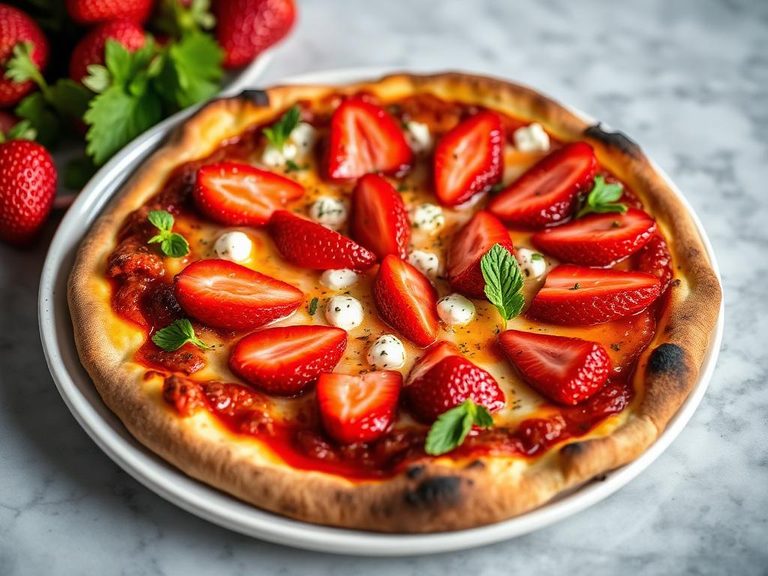
Pizza, cheese, with fruit, thin crust
Common food

Photo: Wikipedia
This is a light, crisp thin-crust pizza where sweet fruit like figs, pears, or grapes contrasts with savory melted cheese. The crust offers a satisfying crunch, while the fruit adds juicy bursts of sweetness. Nutritionally, it provides a good protein-to-calorie ratio with moderate carbs and fats.
Calorie split: 16% protein · 52% carbs · 31% fat
↓ Full nutrition💚 Why it's loved
People love the sophisticated sweet-savory flavor profile, which feels both indulgent and slightly lighter than a classic pizza. It's a versatile canvas that can be adapted with seasonal fruits and artisanal cheeses.
⚠️ Watch-outs & how to enjoy it better
The combination of refined crust and sugary fruit can cause a quicker blood sugar spike compared to a veggie-heavy pizza. Those monitoring blood sugar or gluten should be cautious. To counteract, pair a slice with a side salad or lean protein, and practice portion control.
Key benefits
- Good source of protein for muscle maintenance.
- Provides dietary fiber from fruit and crust.
- Lower in fat than many traditional cheese pizzas.
- Offers a balanced mix of carbs, protein, and fat.
- Fruit adds natural sweetness and micronutrients.
🍽️ Popular dishes
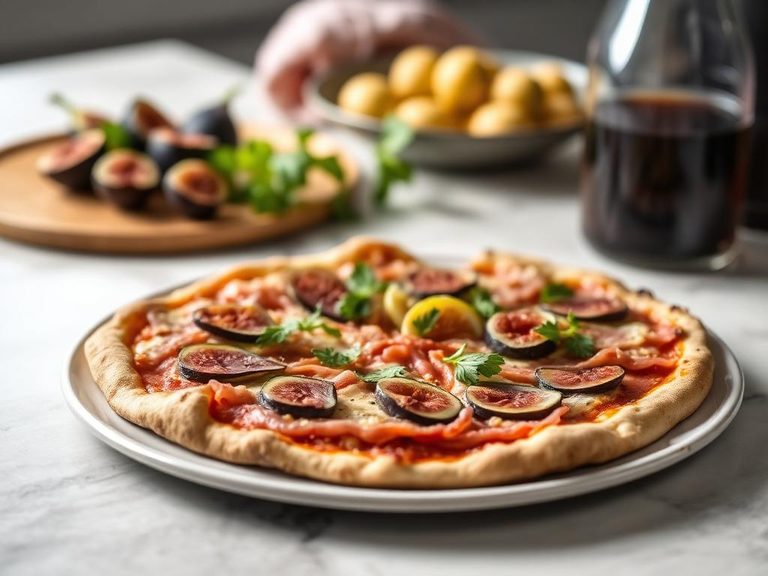
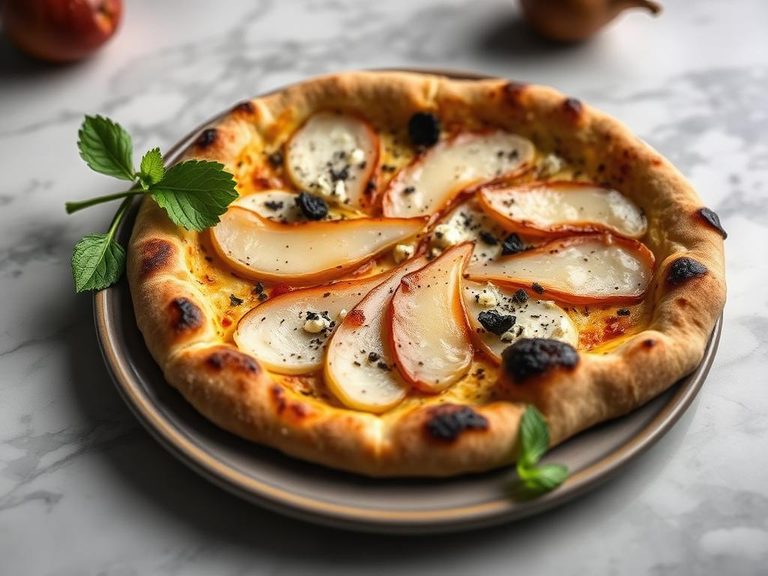
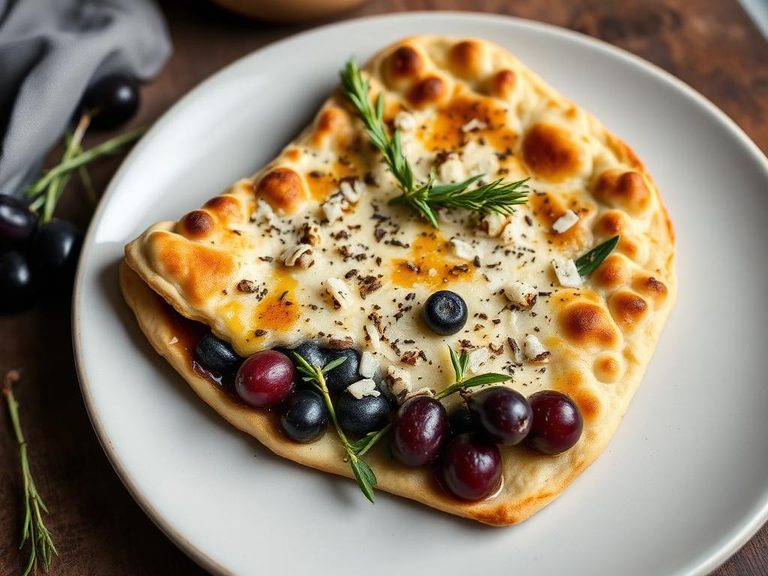
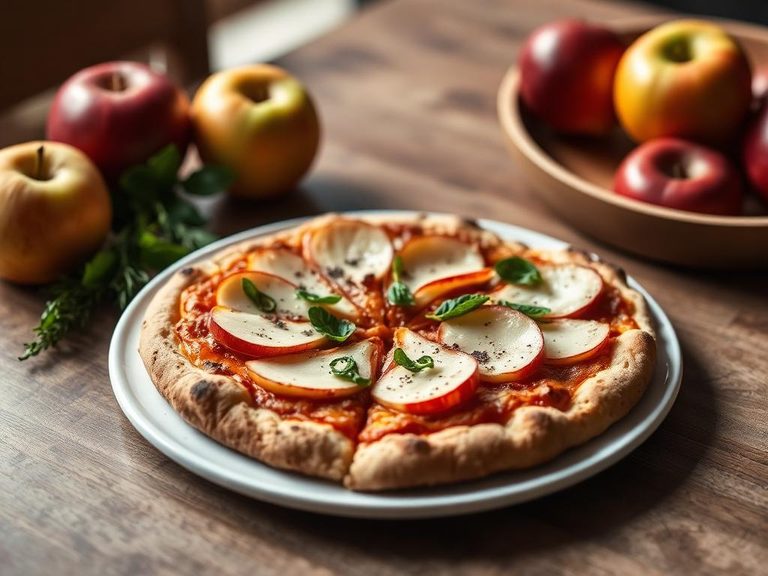
🌍 Where it's eaten
💡 Did you know?
The concept of fruit on pizza dates back to at least the 16th century in Italy, where figs and honey were sometimes used as toppings before the tomato became standard.
Full nutrition (USDA data · scales with serving)
| Water | 50.4 g |
| Energy | 230 kcal |
| Protein | 9.5 g |
| Total lipid (fat) | 8.1 g |
| Carbohydrate, by difference | 30.0 g |
| Fiber, total dietary | 2.1 g |
| Total Sugars | 4.9 g |
| Calcium, Ca | 158 mg |
| Iron, Fe | 2.1 mg |
| Magnesium, Mg | 22.0 mg |
| Phosphorus, P | 180 mg |
| Potassium, K | 164 mg |
| Sodium, Na | 447 mg |
| Zinc, Zn | 1.1 mg |
| Copper, Cu | 0.10 mg |
| Selenium, Se | 16.5 ug |
| Vitamin C, total ascorbic acid | 9.2 mg |
| Thiamin | 0.33 mg |
| Riboflavin | 0.17 mg |
| Niacin | 3.2 mg |
| Vitamin B-6 | 0.08 mg |
| Folate, total | 79.0 ug |
| Folic acid | 43.0 ug |
| Folate, food | 35.0 ug |
| Folate, DFE | 109 ug |
| Choline, total | 14.5 mg |
| Vitamin B-12 | 0.35 ug |
| Vitamin B-12, added | 0.00 ug |
| Vitamin A, RAE | 58.0 ug |
| Retinol | 50.0 ug |
| Carotene, beta | 81.0 ug |
| Carotene, alpha | 0.00 ug |
| Cryptoxanthin, beta | 0.00 ug |
| Lycopene | 1585 ug |
| Lutein + zeaxanthin | 48.0 ug |
| Vitamin E (alpha-tocopherol) | 0.69 mg |
| Vitamin E, added | 0.00 mg |
| Vitamin D (D2 + D3) | 0.00 ug |
| Vitamin K (phylloquinone) | 5.7 ug |
| Alcohol, ethyl | 0.00 g |
| Caffeine | 0.00 mg |
| Theobromine | 0.00 mg |
Fat & fatty acid profile (per 100g)
| Fatty acids, total saturated | 3.7 g |
| SFA 4:0 | 0.08 g |
| SFA 6:0 | 0.07 g |
| SFA 8:0 | 0.05 g |
| SFA 10:0 | 0.12 g |
| SFA 12:0 | 0.14 g |
| SFA 14:0 | 0.50 g |
| SFA 16:0 | 1.9 g |
| SFA 18:0 | 0.71 g |
| Fatty acids, total monounsaturated | 2.2 g |
| MUFA 16:1 | 0.10 g |
| MUFA 18:1 | 2.0 g |
| MUFA 20:1 | 0.03 g |
| MUFA 22:1 | 0.00 g |
| Fatty acids, total polyunsaturated | 1.4 g |
| PUFA 18:2 | 1.2 g |
| PUFA 18:3 | 0.15 g |
| PUFA 18:4 | 0.00 g |
| PUFA 20:4 | 0.01 g |
| PUFA 20:5 n-3 (EPA) | 0.00 g |
| PUFA 22:5 n-3 (DPA) | 0.00 g |
| PUFA 22:6 n-3 (DHA) | 0.00 g |
| Cholesterol | 14.0 mg |
Amino acid profile (per 100g)
Estimated from Fast Food, Pizza Chain, 14" pizza, cheese topping, stuffed crust — USDA does not publish this profile for Pizza.
| Tryptophan | 0.12 g |
| Threonine | 0.39 g |
| Isoleucine | 0.57 g |
| Leucine | 1.1 g |
| Lysine | 0.59 g |
| Methionine | 0.27 g |
| Phenylalanine | 0.64 g |
| Tyrosine | 0.40 g |
| Valine | 0.71 g |
| Arginine | 0.44 g |
| Histidine | 0.32 g |
| Alanine | 0.38 g |
| Aspartic acid | 0.81 g |
| Glutamic acid | 3.4 g |
| Glycine | 0.31 g |
| Proline | 1.7 g |
| Serine | 0.58 g |
| Hydroxyproline | 0.00 g |
FAQ
What fruits work best on this pizza?
Firm, less watery fruits like figs, pears, apples, grapes, and berries hold up best when baked. Softer fruits like peaches or strawberries are better added after baking.
Is this a healthy pizza option?
It's a better-balanced choice than many deep-dish or meat-loaded pizzas, offering protein and fiber. However, the thin crust and fruit sugars mean it's still a treat to be enjoyed in moderation.
Can I make this with a whole-wheat crust?
Absolutely. Using a whole-wheat or cauliflower crust significantly increases the fiber content and can help moderate the blood sugar response, making it a more nutritious base.
Nutrient density (calculated · NRF9.3)
Nutrient Rich Foods index: beneficial nutrients (protein, fiber, vitamins, minerals) minus saturated fat, added sugar & sodium, per 100 kcal.
NRF9.3 index — Fulgoni, Keast & Drewnowski, 2009. Computed from USDA nutrients.
Weight-loss friendliness (composite index)
Energy density 2.30 kcal/g · 17% calories from protein · 2.1 g fiber · 4.9 g sugar per 100 g.
Composite of energy density (Rolls et al., 1999), protein & fiber satiety, minus sugar. A calculated heuristic — ranks satiety-per-calorie, not a clinical measure.
Dietary load (calculated from USDA values)
Potential renal acid load. Positive = acid-forming, negative = alkaline-forming.
Sodium-to-potassium ratio: 2.73 (lower is better — aim for ≤ 1)
Sodium:potassium per WHO potassium guidance. Computed from USDA nutrients.