

Peanut butter, reduced fat
Common food

Photo: Wikipedia
Reduced-fat peanut butter is a creamy, legume-based spread with a familiar nutty sweetness, but with a slightly lighter texture and a touch more added sugars to compensate for the removed oil. It packs a solid 25.9g of protein per 100g, making it a surprisingly potent plant-based protein source, though its carbohydrate count is higher than traditional versions.
Calorie split: 19% protein · 26% carbs · 55% fat
↓ Full nutrition💚 Why it's loved
People love it for its classic, comforting peanut flavor that's both sweet and savory, and its incredible versatility—from spreading on toast to blending into smoothies or sauces. It's a staple in American pantries and a key ingredient in global cuisines.
⚠️ Watch-outs & how to enjoy it better
The reduced-fat version often contains added sugars (9.28g per 100g) and sometimes extra sodium to enhance flavor, which can lead to quicker blood sugar spikes compared to natural varieties. As a top allergen, it must be avoided by those with peanut allergies; a practical tip is to always check labels and consider sunflower seed butter as a safe, nutrient-dense substitute.
Key benefits
- High in plant-based protein (25.9g per 100g)
- Good source of dietary fiber (5.2g per 100g)
- Provides heart-healthy monounsaturated fats
- Convenient, shelf-stable protein and energy source
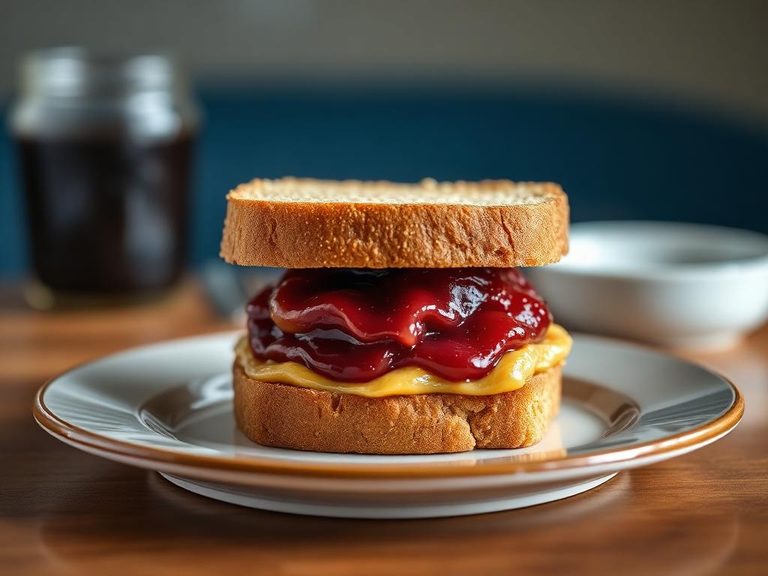
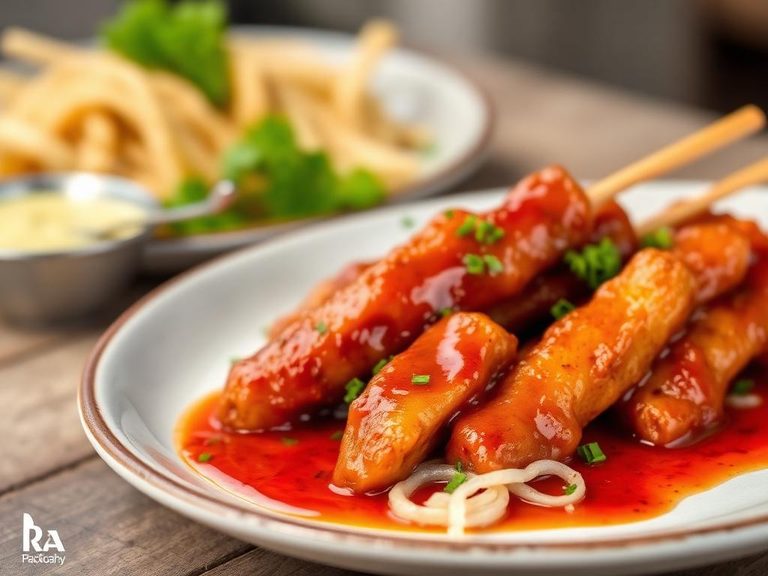
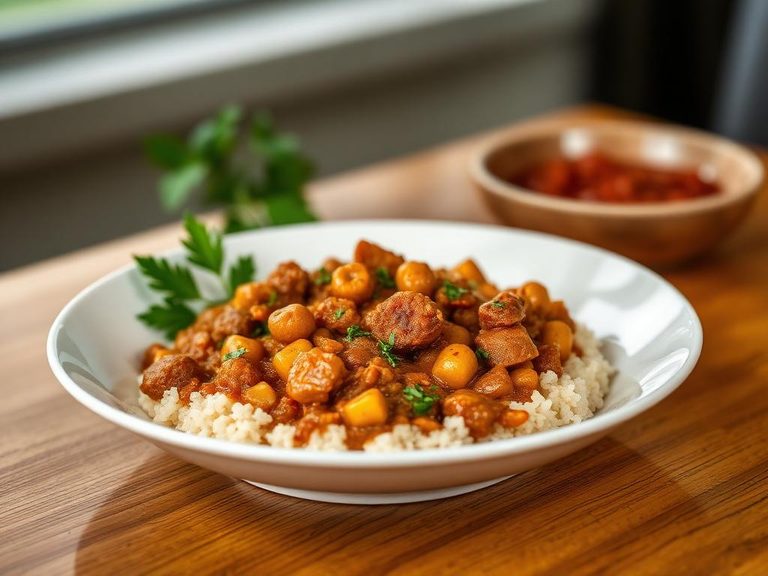
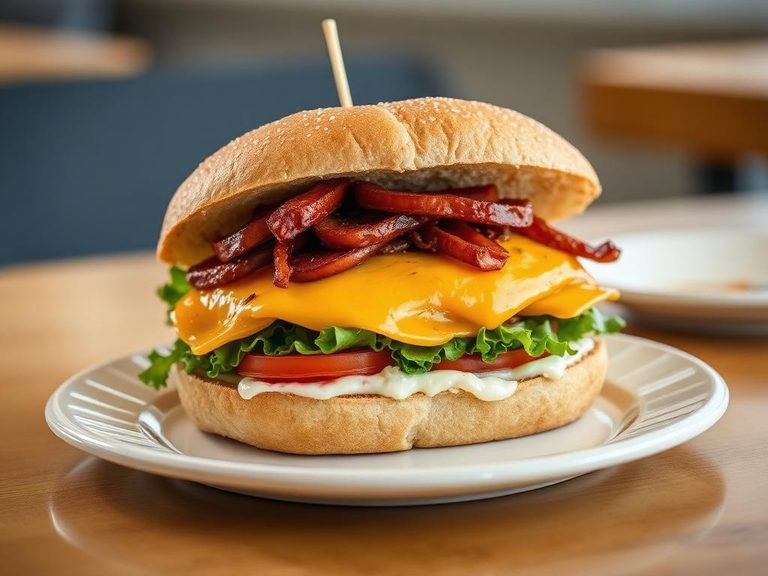
🍽️ Popular dishes
🌍 Where it's eaten
💡 Did you know?
It takes about 540 peanuts to make one 12-ounce jar of peanut butter.
Full nutrition (USDA data · scales with serving)
| Water | 1.2 g |
| Energy | 520 kcal |
| Protein | 25.9 g |
| Total lipid (fat) | 34.0 g |
| Carbohydrate, by difference | 35.6 g |
| Fiber, total dietary | 5.2 g |
| Total Sugars | 9.3 g |
| Calcium, Ca | 35.0 mg |
| Iron, Fe | 1.9 mg |
| Magnesium, Mg | 170 mg |
| Phosphorus, P | 369 mg |
| Potassium, K | 669 mg |
| Sodium, Na | 540 mg |
| Zinc, Zn | 2.8 mg |
| Copper, Cu | 0.58 mg |
| Selenium, Se | 7.5 ug |
| Vitamin C, total ascorbic acid | 0.00 mg |
| Thiamin | 0.27 mg |
| Riboflavin | 0.06 mg |
| Niacin | 14.6 mg |
| Vitamin B-6 | 0.31 mg |
| Folate, total | 60.0 ug |
| Folic acid | 0.00 ug |
| Folate, food | 60.0 ug |
| Folate, DFE | 60.0 ug |
| Choline, total | 63.4 mg |
| Vitamin B-12 | 0.00 ug |
| Vitamin B-12, added | 0.00 ug |
| Vitamin A, RAE | 0.00 ug |
| Retinol | 0.00 ug |
| Carotene, beta | 0.00 ug |
| Carotene, alpha | 0.00 ug |
| Cryptoxanthin, beta | 0.00 ug |
| Lycopene | 0.00 ug |
| Lutein + zeaxanthin | 0.00 ug |
| Vitamin E (alpha-tocopherol) | 9.0 mg |
| Vitamin E, added | 0.00 mg |
| Vitamin D (D2 + D3) | 0.00 ug |
| Vitamin K (phylloquinone) | 0.60 ug |
| Alcohol, ethyl | 0.00 g |
| Caffeine | 0.00 mg |
| Theobromine | 0.00 mg |
Fat & fatty acid profile (per 100g)
| Fatty acids, total saturated | 5.8 g |
| SFA 4:0 | 0.00 g |
| SFA 6:0 | 0.00 g |
| SFA 8:0 | 0.00 g |
| SFA 10:0 | 0.00 g |
| SFA 12:0 | 0.01 g |
| SFA 14:0 | 0.14 g |
| SFA 16:0 | 3.8 g |
| SFA 18:0 | 1.8 g |
| Fatty acids, total monounsaturated | 16.2 g |
| MUFA 16:1 | 0.00 g |
| MUFA 18:1 | 15.9 g |
| MUFA 20:1 | 0.29 g |
| MUFA 22:1 | 0.00 g |
| Fatty acids, total polyunsaturated | 9.2 g |
| PUFA 18:2 | 9.1 g |
| PUFA 18:3 | 0.05 g |
| PUFA 18:4 | 0.00 g |
| PUFA 20:4 | 0.00 g |
| PUFA 20:5 n-3 (EPA) | 0.00 g |
| PUFA 22:5 n-3 (DPA) | 0.00 g |
| PUFA 22:6 n-3 (DHA) | 0.00 g |
| Cholesterol | 0.00 mg |
Amino acid profile (per 100g)
Estimated from Cookies, peanut butter, refrigerated dough, baked — USDA does not publish this profile for Peanut butter.
| Tryptophan | 0.11 g |
| Threonine | 0.30 g |
| Isoleucine | 0.36 g |
| Leucine | 0.63 g |
| Lysine | 0.37 g |
| Methionine | 0.14 g |
| Cystine | 0.16 g |
| Phenylalanine | 0.45 g |
| Tyrosine | 0.32 g |
| Valine | 0.41 g |
| Arginine | 0.69 g |
| Histidine | 0.21 g |
| Alanine | 0.35 g |
| Aspartic acid | 0.77 g |
| Glutamic acid | 2.2 g |
| Glycine | 0.41 g |
| Proline | 0.64 g |
| Serine | 0.49 g |
FAQ
Is reduced-fat peanut butter healthier than regular?
Not necessarily. While lower in fat and total calories, it often has more added sugar and sometimes more sodium to compensate for flavor. The protein content remains high, but the overall nutritional trade-off depends on your dietary goals.
Why does it have more carbs than regular peanut butter?
Manufacturers typically replace the removed fat with fillers like maltodextrin or dextrose (simple sugars) to maintain texture and taste, which increases the carbohydrate and sugar content.
Can I use it in baking as a 1:1 substitute for regular peanut butter?
You can, but expect differences. The higher sugar and lower fat content may make baked goods slightly sweeter, less rich, and potentially drier. You might need to adjust other fats or liquids in the recipe.
Nutrient density (calculated · NRF9.3)
Nutrient Rich Foods index: beneficial nutrients (protein, fiber, vitamins, minerals) minus saturated fat, added sugar & sodium, per 100 kcal.
NRF9.3 index — Fulgoni, Keast & Drewnowski, 2009. Computed from USDA nutrients.
Weight-loss friendliness (composite index)
Energy density 5.20 kcal/g · 20% calories from protein · 5.2 g fiber · 9.3 g sugar per 100 g.
Composite of energy density (Rolls et al., 1999), protein & fiber satiety, minus sugar. A calculated heuristic — ranks satiety-per-calorie, not a clinical measure.
Dietary load (calculated from USDA values)
Potential renal acid load. Positive = acid-forming, negative = alkaline-forming.
Sodium-to-potassium ratio: 0.81 (lower is better — aim for ≤ 1)
Sodium:potassium per WHO potassium guidance. Computed from USDA nutrients.