

Fish, perch, baked or broiled
Common food

Photo: Wikipedia
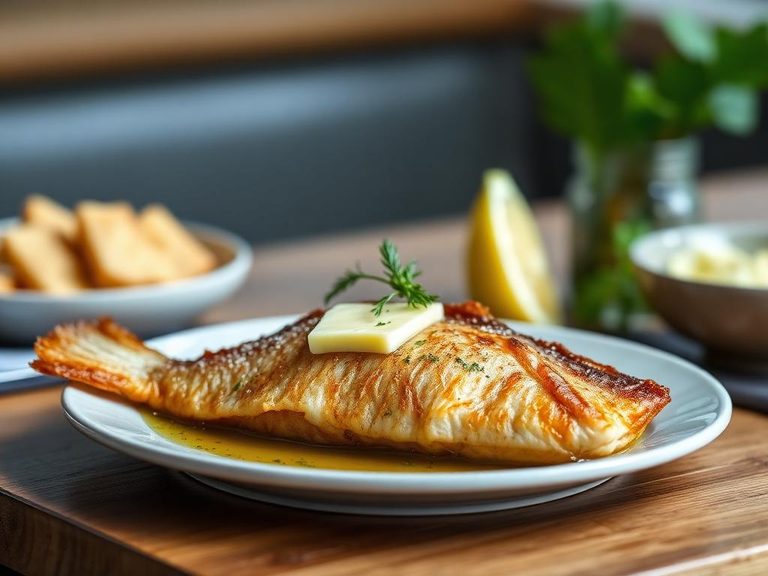
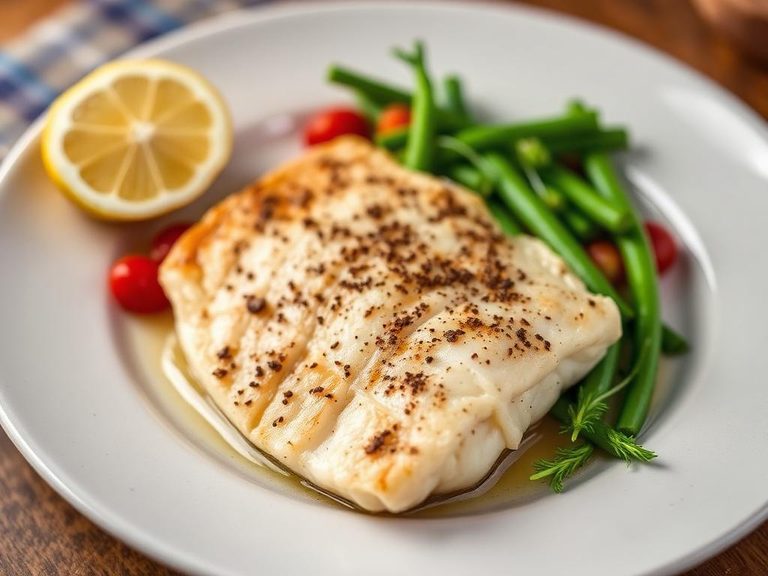
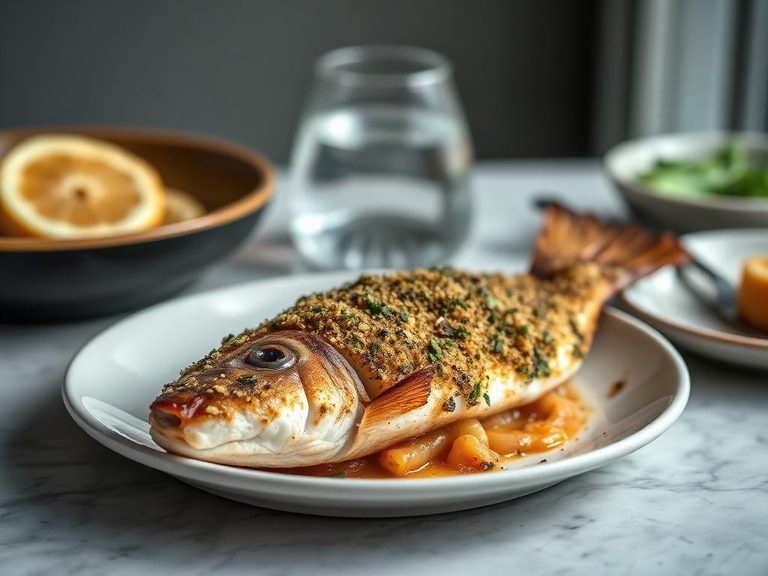
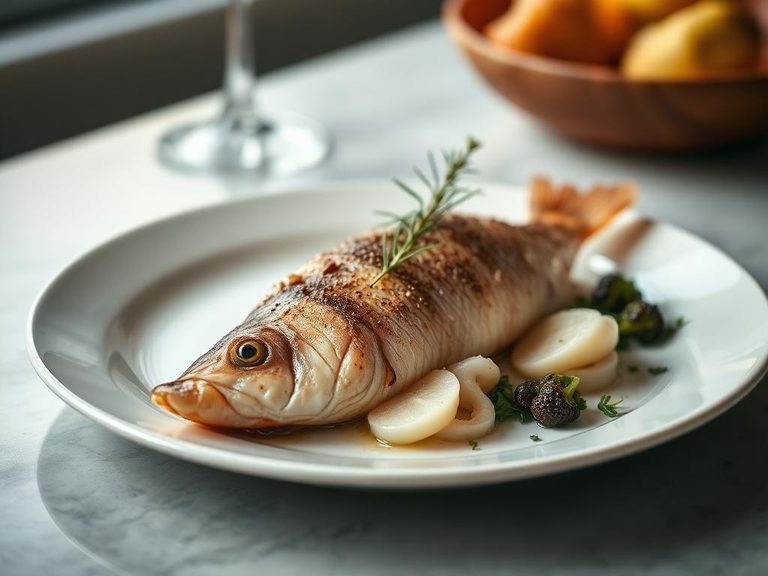
Baked or broiled perch is a lean, freshwater fish with a delicate, mildly sweet flavor and a tender, flaky texture that becomes beautifully golden and slightly crisp at the edges. With an impressive 19 grams of protein and virtually zero carbohydrates per 100g, it's a powerhouse of pure, high-quality nutrition.
Calorie split: 57% protein · 0% carbs · 43% fat
↓ Full nutrition💚 Why it's loved
People cherish perch for its clean, non-fishy taste that acts as a perfect canvas for herbs, lemon, or light sauces. Its versatility makes it a staple from simple weeknight dinners to elegant restaurant presentations, often symbolizing fresh, lakeside cuisine.
⚠️ Watch-outs & how to enjoy it better
As a freshwater fish, perch can occasionally have a subtle 'muddy' taste if not sourced from clean waters. To counteract this, soak fillets in milk or a saltwater brine for 30 minutes before cooking, and always source from reputable fisheries. It is also a common allergen for those with fish sensitivities.
Key benefits
- Excellent source of lean, complete protein
- Extremely low in carbohydrates and sugars
- Rich in essential vitamins like B12 and niacin
- Provides healthy omega-3 fatty acids
- Low-calorie option for weight management
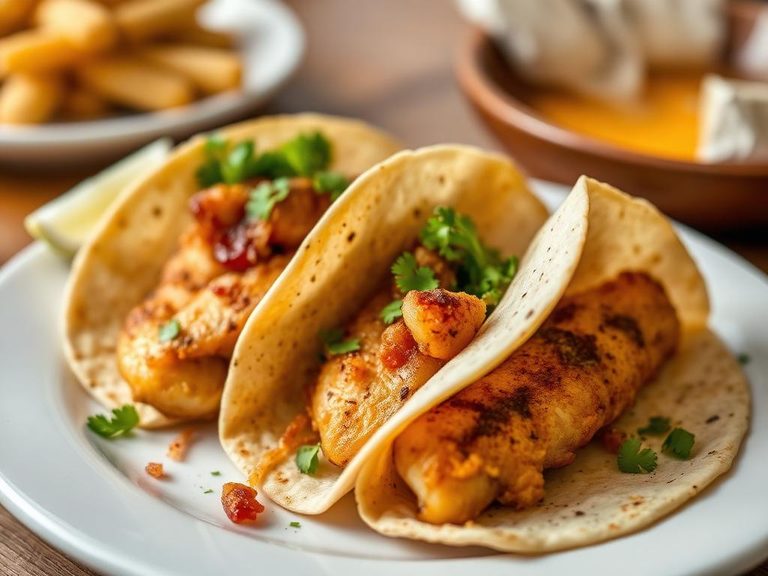
🍽️ Popular dishes
🌍 Where it's eaten
💡 Did you know?
Yellow perch is the official state fish of Ohio and is so iconic to the Great Lakes region that it's often the star of traditional 'fish fry' events.
Full nutrition (USDA data · scales with serving)
| Water | 73.9 g |
| Energy | 139 kcal |
| Protein | 19.0 g |
| Total lipid (fat) | 6.5 g |
| Carbohydrate, by difference | 0.01 g |
| Fiber, total dietary | 0.00 g |
| Total Sugars | 0.01 g |
| Calcium, Ca | 36.0 mg |
| Iron, Fe | 0.28 mg |
| Magnesium, Mg | 29.0 mg |
| Phosphorus, P | 308 mg |
| Potassium, K | 233 mg |
| Sodium, Na | 309 mg |
| Zinc, Zn | 0.36 mg |
| Copper, Cu | 0.03 mg |
| Selenium, Se | 35.5 ug |
| Vitamin C, total ascorbic acid | 0.00 mg |
| Thiamin | 0.04 mg |
| Riboflavin | 0.06 mg |
| Niacin | 1.2 mg |
| Vitamin B-6 | 0.11 mg |
| Folate, total | 10.0 ug |
| Folic acid | 0.00 ug |
| Folate, food | 10.0 ug |
| Folate, DFE | 10.0 ug |
| Choline, total | 81.1 mg |
| Vitamin B-12 | 1.7 ug |
| Vitamin B-12, added | 0.00 ug |
| Vitamin A, RAE | 33.0 ug |
| Retinol | 32.0 ug |
| Carotene, beta | 9.0 ug |
| Carotene, alpha | 0.00 ug |
| Cryptoxanthin, beta | 0.00 ug |
| Lycopene | 0.00 ug |
| Lutein + zeaxanthin | 0.00 ug |
| Vitamin E (alpha-tocopherol) | 1.6 mg |
| Vitamin E, added | 0.00 mg |
| Vitamin D (D2 + D3) | 1.5 ug |
| Vitamin K (phylloquinone) | 3.9 ug |
| Alcohol, ethyl | 0.00 g |
| Caffeine | 0.00 mg |
| Theobromine | 0.00 mg |
Fat & fatty acid profile (per 100g)
| Fatty acids, total saturated | 1.5 g |
| SFA 4:0 | 0.03 g |
| SFA 6:0 | 0.02 g |
| SFA 8:0 | 0.01 g |
| SFA 10:0 | 0.03 g |
| SFA 12:0 | 0.04 g |
| SFA 14:0 | 0.19 g |
| SFA 16:0 | 0.84 g |
| SFA 18:0 | 0.30 g |
| Fatty acids, total monounsaturated | 2.2 g |
| MUFA 16:1 | 0.12 g |
| MUFA 18:1 | 1.8 g |
| MUFA 20:1 | 0.21 g |
| MUFA 22:1 | 0.04 g |
| Fatty acids, total polyunsaturated | 1.7 g |
| PUFA 18:2 | 1.2 g |
| PUFA 18:3 | 0.16 g |
| PUFA 18:4 | 0.01 g |
| PUFA 20:4 | 0.01 g |
| PUFA 20:5 n-3 (EPA) | 0.08 g |
| PUFA 22:5 n-3 (DPA) | 0.01 g |
| PUFA 22:6 n-3 (DHA) | 0.19 g |
| Cholesterol | 68.0 mg |
Amino acid profile (per 100g)
Estimated from Fish, fish sticks, frozen, prepared — USDA does not publish this profile for Fish.
| Tryptophan | 0.12 g |
| Threonine | 0.37 g |
| Isoleucine | 0.43 g |
| Leucine | 0.85 g |
| Lysine | 0.80 g |
| Methionine | 0.30 g |
| Phenylalanine | 0.47 g |
| Tyrosine | 0.29 g |
| Valine | 0.50 g |
| Arginine | 0.59 g |
| Histidine | 0.23 g |
| Alanine | 0.55 g |
| Aspartic acid | 0.82 g |
| Glutamic acid | 2.3 g |
| Glycine | 0.47 g |
| Proline | 0.78 g |
| Serine | 0.49 g |
| Hydroxyproline | 0.00 g |
FAQ
What does perch taste like?
Perch has a mild, slightly sweet, and delicate flavor with a clean finish, making it much less 'fishy' than stronger varieties like mackerel or sardines.
Is baked perch healthy?
Yes, it's very healthy. It's a low-calorie, high-protein food that's virtually carb-free and provides beneficial nutrients like vitamin B12 and omega-3s.
How do I know when baked perch is done?
The fish is done when it turns opaque and flakes easily when pressed with a fork. For a 1-inch thick fillet, baking at 400°F (200°C) typically takes 10-12 minutes.
Nutrient density (calculated · NRF9.3)
Nutrient Rich Foods index: beneficial nutrients (protein, fiber, vitamins, minerals) minus saturated fat, added sugar & sodium, per 100 kcal.
NRF9.3 index — Fulgoni, Keast & Drewnowski, 2009. Computed from USDA nutrients.
Weight-loss friendliness (composite index)
Energy density 1.39 kcal/g · 55% calories from protein · 0.0 g fiber · 0.0 g sugar per 100 g.
Composite of energy density (Rolls et al., 1999), protein & fiber satiety, minus sugar. A calculated heuristic — ranks satiety-per-calorie, not a clinical measure.
Dietary load (calculated from USDA values)
Potential renal acid load. Positive = acid-forming, negative = alkaline-forming.
Sodium-to-potassium ratio: 1.33 (lower is better — aim for ≤ 1)
Sodium:potassium per WHO potassium guidance. Computed from USDA nutrients.