

Fish, perch, baked or broiled, coated
Common food

Photo: Wikipedia
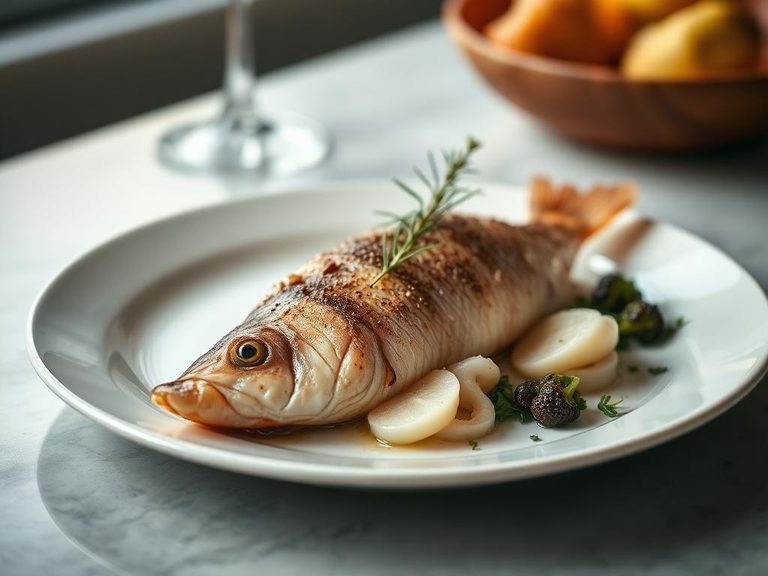
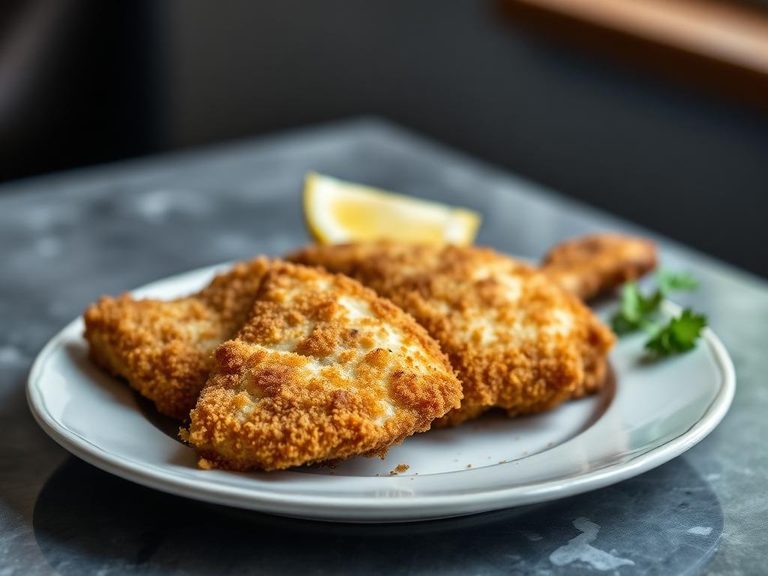
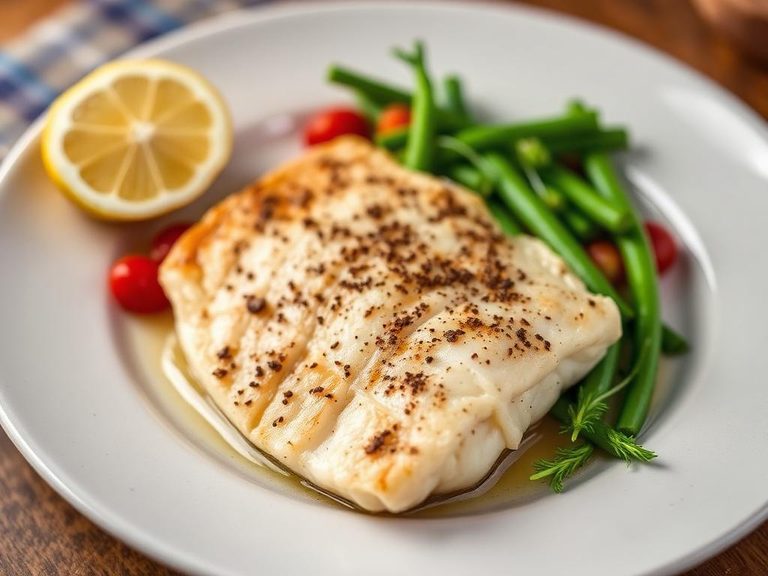
Baked or broiled coated perch offers a delicate, flaky white fish experience with a satisfying, lightly crisp exterior. Its mild, subtly sweet flavor is enhanced by the golden crust, creating a tender texture that contrasts beautifully with the coating. With 17.33g of high-quality protein per 100g, it's a lean, nutrient-dense choice for a satisfying meal.
Calorie split: 44% protein · 20% carbs · 37% fat
↓ Full nutrition💚 Why it's loved
People adore it for its approachable, mild flavor that acts as a perfect canvas for seasonings, and its quick, easy preparation makes it a weeknight staple. The textural contrast between the crisp coating and tender flesh is universally appealing.
⚠️ Watch-outs & how to enjoy it better
The coating, often made with flour or breadcrumbs, can add refined carbs and may be high in sodium depending on seasoning. Those monitoring blood sugar or sodium intake should be mindful of portion size and seasoning blends. Counteract by pairing with non-starchy vegetables and using herbs and spices instead of salt for flavor.
Key benefits
- Excellent source of lean, complete protein for muscle maintenance.
- Low in saturated fat and a good source of heart-healthy omega-3s.
- Provides essential minerals like selenium and phosphorus.
- Light yet satisfying, ideal for a balanced dinner plate.
🍽️ Popular dishes
🌍 Where it's eaten
💡 Did you know?
Yellow perch was so abundant in the Great Lakes in the late 1800s that it was often used as pig feed before becoming a prized commercial and sport fish.
Full nutrition (USDA data · scales with serving)
| Water | 67.6 g |
| Energy | 163 kcal |
| Protein | 17.3 g |
| Total lipid (fat) | 6.5 g |
| Carbohydrate, by difference | 7.8 g |
| Fiber, total dietary | 0.30 g |
| Total Sugars | 0.14 g |
| Calcium, Ca | 40.0 mg |
| Iron, Fe | 0.82 mg |
| Magnesium, Mg | 27.0 mg |
| Phosphorus, P | 276 mg |
| Potassium, K | 213 mg |
| Sodium, Na | 342 mg |
| Zinc, Zn | 0.40 mg |
| Copper, Cu | 0.04 mg |
| Selenium, Se | 32.0 ug |
| Vitamin C, total ascorbic acid | 0.00 mg |
| Thiamin | 0.13 mg |
| Riboflavin | 0.10 mg |
| Niacin | 1.7 mg |
| Vitamin B-6 | 0.11 mg |
| Folate, total | 25.0 ug |
| Folic acid | 13.0 ug |
| Folate, food | 12.0 ug |
| Folate, DFE | 34.0 ug |
| Choline, total | 73.0 mg |
| Vitamin B-12 | 1.4 ug |
| Vitamin B-12, added | 0.00 ug |
| Vitamin A, RAE | 33.0 ug |
| Retinol | 32.0 ug |
| Carotene, beta | 9.0 ug |
| Carotene, alpha | 0.00 ug |
| Cryptoxanthin, beta | 0.00 ug |
| Lycopene | 0.00 ug |
| Lutein + zeaxanthin | 7.0 ug |
| Vitamin E (alpha-tocopherol) | 1.5 mg |
| Vitamin E, added | 0.00 mg |
| Vitamin D (D2 + D3) | 1.3 ug |
| Vitamin K (phylloquinone) | 4.0 ug |
| Alcohol, ethyl | 0.00 g |
| Caffeine | 0.00 mg |
| Theobromine | 0.00 mg |
Fat & fatty acid profile (per 100g)
| Fatty acids, total saturated | 1.5 g |
| SFA 4:0 | 0.03 g |
| SFA 6:0 | 0.02 g |
| SFA 8:0 | 0.01 g |
| SFA 10:0 | 0.03 g |
| SFA 12:0 | 0.04 g |
| SFA 14:0 | 0.18 g |
| SFA 16:0 | 0.86 g |
| SFA 18:0 | 0.31 g |
| Fatty acids, total monounsaturated | 2.2 g |
| MUFA 16:1 | 0.11 g |
| MUFA 18:1 | 1.8 g |
| MUFA 20:1 | 0.18 g |
| MUFA 22:1 | 0.03 g |
| Fatty acids, total polyunsaturated | 1.7 g |
| PUFA 18:2 | 1.3 g |
| PUFA 18:3 | 0.17 g |
| PUFA 18:4 | 0.01 g |
| PUFA 20:4 | 0.01 g |
| PUFA 20:5 n-3 (EPA) | 0.07 g |
| PUFA 22:5 n-3 (DPA) | 0.01 g |
| PUFA 22:6 n-3 (DHA) | 0.16 g |
| Cholesterol | 62.0 mg |
Amino acid profile (per 100g)
Estimated from Fish, fish sticks, frozen, prepared — USDA does not publish this profile for Fish.
| Tryptophan | 0.12 g |
| Threonine | 0.37 g |
| Isoleucine | 0.43 g |
| Leucine | 0.85 g |
| Lysine | 0.80 g |
| Methionine | 0.30 g |
| Phenylalanine | 0.47 g |
| Tyrosine | 0.29 g |
| Valine | 0.50 g |
| Arginine | 0.59 g |
| Histidine | 0.23 g |
| Alanine | 0.55 g |
| Aspartic acid | 0.82 g |
| Glutamic acid | 2.3 g |
| Glycine | 0.47 g |
| Proline | 0.78 g |
| Serine | 0.49 g |
| Hydroxyproline | 0.00 g |
FAQ
Is coated perch fried or baked?
It can be either. The nutritional data provided is for a baked or broiled preparation, which uses less oil than pan-frying or deep-frying, resulting in a lower fat content.
What is the coating typically made of?
Common coatings include a light dusting of flour, a breadcrumb mixture (panko or regular), or a cornmeal crust, sometimes with added herbs and spices for flavor.
How do I know when it's cooked through?
The fish is done when it reaches an internal temperature of 145°F (63°C), the flesh is opaque and flakes easily with a fork, and the coating is golden and crisp.
Nutrient density (calculated · NRF9.3)
Nutrient Rich Foods index: beneficial nutrients (protein, fiber, vitamins, minerals) minus saturated fat, added sugar & sodium, per 100 kcal.
NRF9.3 index — Fulgoni, Keast & Drewnowski, 2009. Computed from USDA nutrients.
Weight-loss friendliness (composite index)
Energy density 1.63 kcal/g · 43% calories from protein · 0.3 g fiber · 0.1 g sugar per 100 g.
Composite of energy density (Rolls et al., 1999), protein & fiber satiety, minus sugar. A calculated heuristic — ranks satiety-per-calorie, not a clinical measure.
Dietary load (calculated from USDA values)
Potential renal acid load. Positive = acid-forming, negative = alkaline-forming.
Sodium-to-potassium ratio: 1.61 (lower is better — aim for ≤ 1)
Sodium:potassium per WHO potassium guidance. Computed from USDA nutrients.