

Cookie, oatmeal sandwich, with creme filling
Common food
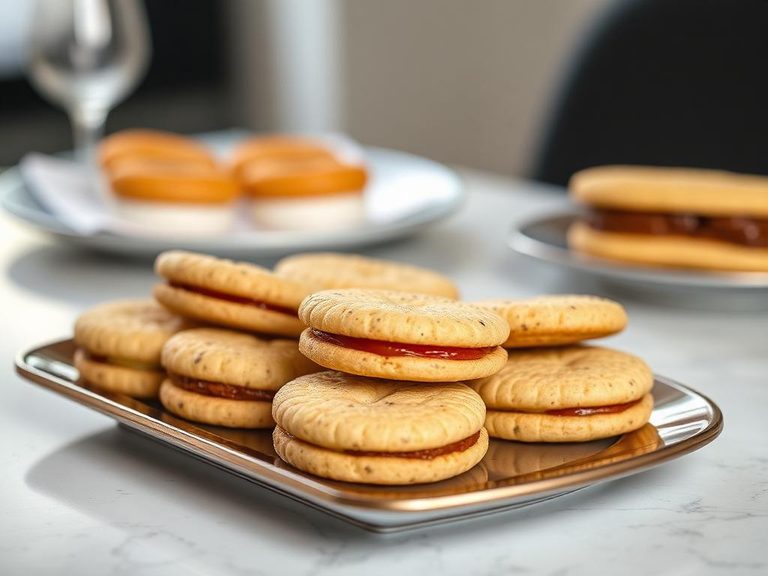
An oatmeal sandwich cookie consists of two chewy, oat-flecked cookies hugging a sweet, creamy filling. The texture is a delightful contrast between the hearty, slightly coarse oats and the smooth, sugary center. Nutritionally, it's a calorie-dense treat where carbohydrates, primarily from sugar and refined flour, dominate the profile.
Calorie split: 3% protein · 56% carbs · 41% fat
↓ Full nutrition💚 Why it's loved
People love it for the nostalgic, comforting combination of chewy oats and sweet cream, a texture and flavor profile reminiscent of childhood. Its pre-packaged convenience makes it a go-to for a quick, indulgent pick-me-up or a lunchbox treat.
⚠️ Watch-outs & how to enjoy it better
The high sugar content (over 30g per 100g) can lead to rapid blood-sugar spikes and subsequent crashes, making it a poor choice for sustained energy. It's also high in calories and low in protein, so pairing it with a source of protein or fat (like a handful of nuts or a glass of milk) can help slow sugar absorption and increase satiety. Those monitoring sodium or with gluten or dairy allergies should check labels carefully.
Key benefits
- Provides quick energy from carbohydrates
- Offers a small amount of dietary fiber from oats
- Convenient, shelf-stable snack or dessert
- Satisfies sweet cravings in a familiar, comforting form
🍽️ Popular dishes

🌍 Where it's eaten
💡 Did you know?
The most famous oatmeal sandwich cookie, the Little Debbie Oatmeal Creme Pie, was first produced in 1960 and was the company's first snack cake product.
Full nutrition (USDA data · scales with serving)
| Water | 22.1 g |
| Energy | 398 kcal |
| Protein | 2.6 g |
| Total lipid (fat) | 18.3 g |
| Carbohydrate, by difference | 55.6 g |
| Fiber, total dietary | 2.6 g |
| Total Sugars | 31.4 g |
| Calcium, Ca | 0.00 mg |
| Iron, Fe | 1.9 mg |
| Magnesium, Mg | 35.0 mg |
| Phosphorus, P | 94.0 mg |
| Potassium, K | 136 mg |
| Sodium, Na | 500 mg |
| Zinc, Zn | 0.67 mg |
| Copper, Cu | 0.14 mg |
| Selenium, Se | 6.8 ug |
| Vitamin C, total ascorbic acid | 0.00 mg |
| Thiamin | 0.24 mg |
| Riboflavin | 0.11 mg |
| Niacin | 1.1 mg |
| Vitamin B-6 | 0.05 mg |
| Folate, total | 38.0 ug |
| Folic acid | 25.0 ug |
| Folate, food | 13.0 ug |
| Folate, DFE | 56.0 ug |
| Choline, total | 8.7 mg |
| Vitamin B-12 | 0.01 ug |
| Vitamin B-12, added | 0.00 ug |
| Vitamin A, RAE | 1.0 ug |
| Retinol | 1.0 ug |
| Carotene, beta | 0.00 ug |
| Carotene, alpha | 0.00 ug |
| Cryptoxanthin, beta | 0.00 ug |
| Lycopene | 0.00 ug |
| Lutein + zeaxanthin | 6.0 ug |
| Vitamin E (alpha-tocopherol) | 2.2 mg |
| Vitamin E, added | 0.00 mg |
| Vitamin D (D2 + D3) | 0.00 ug |
| Vitamin K (phylloquinone) | 5.4 ug |
| Alcohol, ethyl | 0.00 g |
| Caffeine | 0.00 mg |
| Theobromine | 0.00 mg |
Fat & fatty acid profile (per 100g)
| Fatty acids, total saturated | 5.2 g |
| SFA 4:0 | 0.00 g |
| SFA 6:0 | 0.00 g |
| SFA 8:0 | 0.00 g |
| SFA 10:0 | 0.00 g |
| SFA 12:0 | 0.01 g |
| SFA 14:0 | 0.08 g |
| SFA 16:0 | 4.1 g |
| SFA 18:0 | 1.0 g |
| Fatty acids, total monounsaturated | 4.5 g |
| MUFA 16:1 | 0.03 g |
| MUFA 18:1 | 4.5 g |
| MUFA 20:1 | 0.00 g |
| MUFA 22:1 | 0.00 g |
| Fatty acids, total polyunsaturated | 7.4 g |
| PUFA 18:2 | 7.0 g |
| PUFA 18:3 | 0.44 g |
| PUFA 18:4 | 0.00 g |
| PUFA 20:4 | 0.00 g |
| PUFA 20:5 n-3 (EPA) | 0.00 g |
| PUFA 22:5 n-3 (DPA) | 0.00 g |
| PUFA 22:6 n-3 (DHA) | 0.00 g |
| Cholesterol | 0.00 mg |
Amino acid profile (per 100g)
Estimated from Pie Crust, Cookie-type, Chocolate, Ready Crust — USDA does not publish this profile for Cookie.
| Tryptophan | 0.08 g |
| Threonine | 0.20 g |
| Isoleucine | 0.23 g |
| Leucine | 0.38 g |
| Lysine | 0.24 g |
| Methionine | 0.07 g |
| Cystine | 0.11 g |
| Phenylalanine | 0.28 g |
| Tyrosine | 0.16 g |
| Valine | 0.32 g |
| Arginine | 0.29 g |
| Histidine | 0.11 g |
| Alanine | 0.24 g |
| Aspartic acid | 0.45 g |
| Glutamic acid | 1.3 g |
| Glycine | 0.24 g |
| Proline | 0.42 g |
| Serine | 0.26 g |
FAQ
What is the filling made of?
The creme filling is typically a mixture of sugar, vegetable oil (like palm or soybean oil), corn syrup, and emulsifiers, creating a sweet, smooth, and shelf-stable texture.
Are the oats in the cookie whole grain?
While they contain oats, the primary flour is usually enriched wheat flour. The oats provide texture and flavor but the cookie is not typically considered a whole-grain product.
How does it compare nutritionally to a chocolate sandwich cookie?
They are often similar in calories and fat, but oatmeal sandwich cookies may have slightly more fiber from the oats, while chocolate sandwich cookies often have a marginally higher sugar content.
Nutrient density (calculated · NRF9.3)
Nutrient Rich Foods index: beneficial nutrients (protein, fiber, vitamins, minerals) minus saturated fat, added sugar & sodium, per 100 kcal.
NRF9.3 index — Fulgoni, Keast & Drewnowski, 2009. Computed from USDA nutrients.
Weight-loss friendliness (composite index)
Energy density 3.98 kcal/g · 3% calories from protein · 2.6 g fiber · 31.4 g sugar per 100 g.
Composite of energy density (Rolls et al., 1999), protein & fiber satiety, minus sugar. A calculated heuristic — ranks satiety-per-calorie, not a clinical measure.
Dietary load (calculated from USDA values)
Potential renal acid load. Positive = acid-forming, negative = alkaline-forming.
Sodium-to-potassium ratio: 3.68 (lower is better — aim for ≤ 1)
Sodium:potassium per WHO potassium guidance. Computed from USDA nutrients.