

Caviar
Common food

Photo: Wikipedia
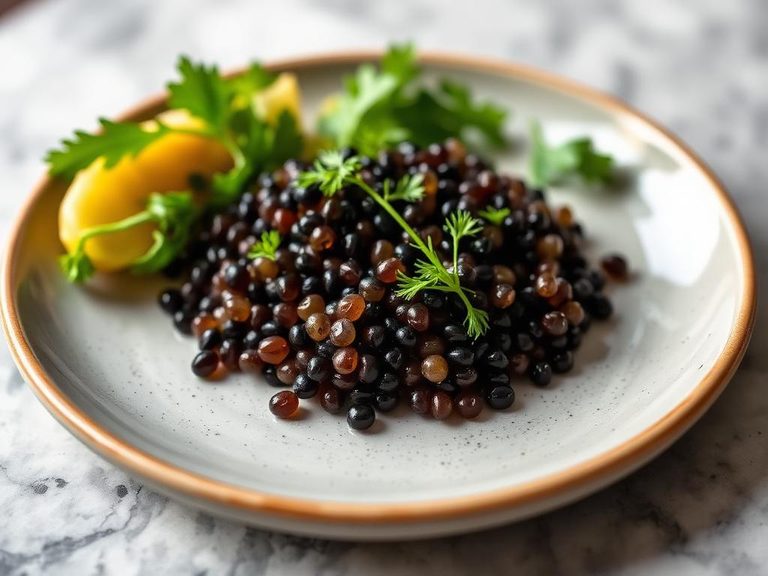
Caviar consists of salt-cured roe (eggs) from sturgeon fish, prized for its luxurious, briny burst and smooth, buttery texture. Nutritionally, it's a potent source of high-quality protein and healthy fats, particularly omega-3 fatty acids, with minimal carbohydrates.
Calorie split: 36% protein · 6% carbs · 58% fat
↓ Full nutrition💚 Why it's loved
People love caviar for its unique, intense umami flavor and the luxurious, celebratory experience it represents. Its versatility allows it to be a standalone delicacy or a sophisticated garnish that elevates other dishes.
⚠️ Watch-outs & how to enjoy it better
Due to its curing process, caviar is very high in sodium, which can be a concern for those monitoring blood pressure. It's also a common allergen (fish eggs) and should be avoided by individuals with fish or seafood allergies. To counteract sodium, enjoy small, mindful portions and pair it with low-sodium foods like unsalted blinis or fresh cucumber.
Key benefits
- Rich in high-quality protein for muscle maintenance
- Excellent source of omega-3 fatty acids (EPA & DHA)
- Provides essential vitamins like B12 and D
- Contains minerals such as iron, selenium, and magnesium
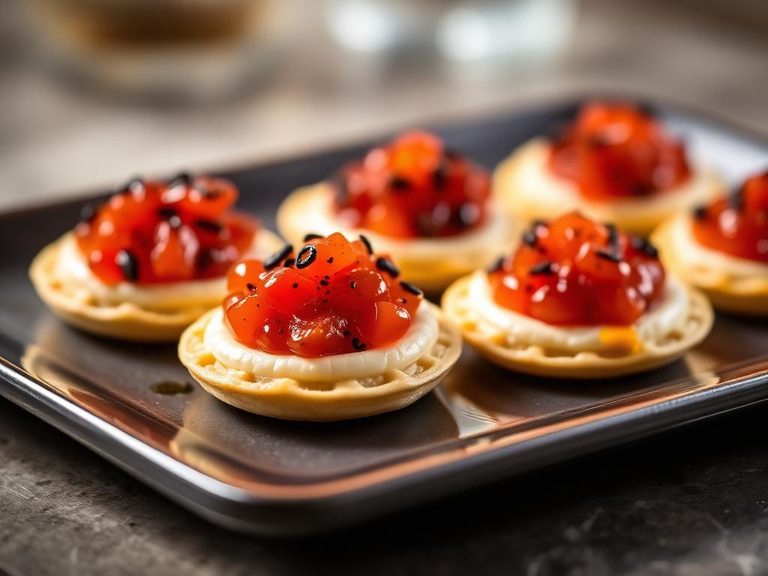
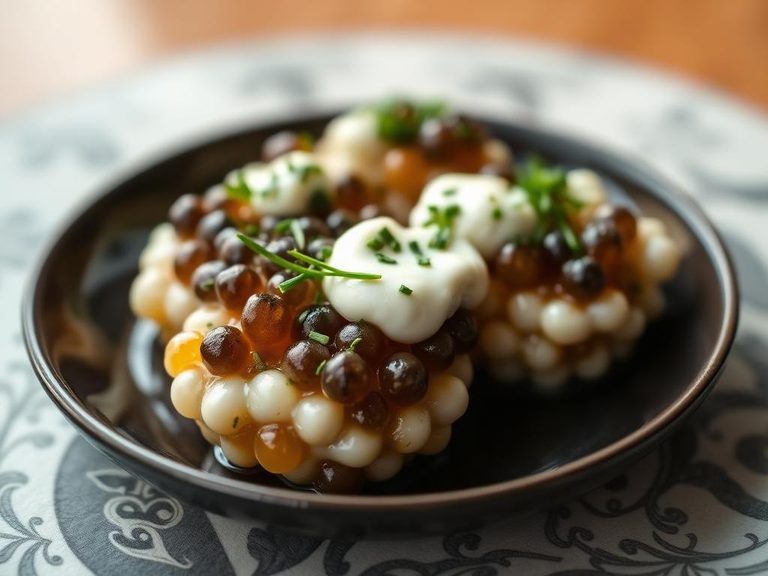
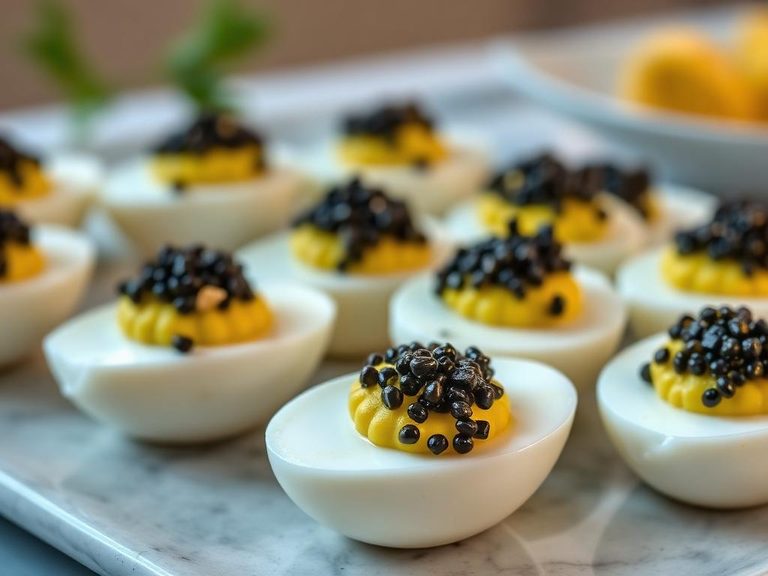
🍽️ Popular dishes
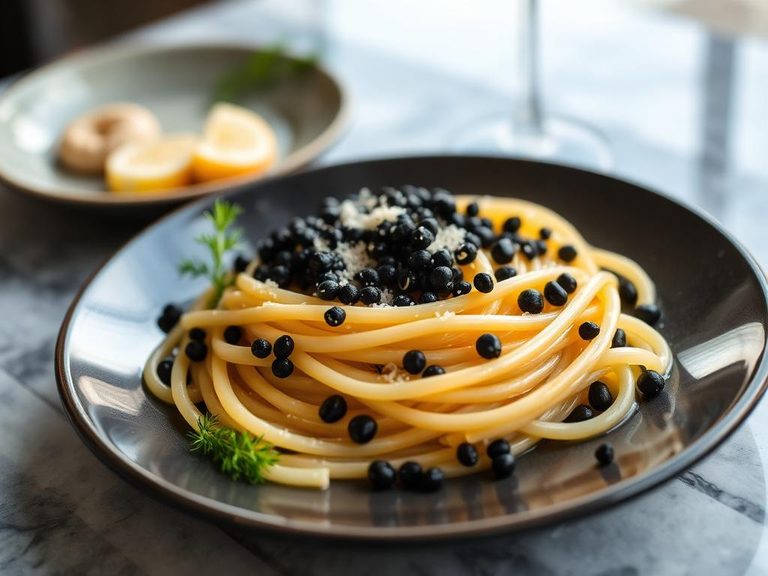
🌍 Where it's eaten
💡 Did you know?
The most prized caviar, Beluga, comes from the massive Beluga sturgeon, which can live over 100 years and weigh more than a small car.
Full nutrition (USDA data · scales with serving)
| Water | 47.5 g |
| Energy | 264 kcal |
| Protein | 24.6 g |
| Total lipid (fat) | 17.9 g |
| Carbohydrate, by difference | 4.0 g |
| Fiber, total dietary | 0.00 g |
| Total Sugars | 0.00 g |
| Calcium, Ca | 275 mg |
| Iron, Fe | 11.9 mg |
| Magnesium, Mg | 300 mg |
| Phosphorus, P | 356 mg |
| Potassium, K | 181 mg |
| Sodium, Na | 1500 mg |
| Zinc, Zn | 0.95 mg |
| Copper, Cu | 0.11 mg |
| Selenium, Se | 65.5 ug |
| Vitamin C, total ascorbic acid | 0.00 mg |
| Thiamin | 0.19 mg |
| Riboflavin | 0.62 mg |
| Niacin | 0.12 mg |
| Vitamin B-6 | 0.32 mg |
| Folate, total | 50.0 ug |
| Folic acid | 0.00 ug |
| Folate, food | 50.0 ug |
| Folate, DFE | 50.0 ug |
| Choline, total | 491 mg |
| Vitamin B-12 | 20.0 ug |
| Vitamin B-12, added | 0.00 ug |
| Vitamin A, RAE | 271 ug |
| Retinol | 271 ug |
| Carotene, beta | 0.00 ug |
| Carotene, alpha | 0.00 ug |
| Cryptoxanthin, beta | 0.00 ug |
| Lycopene | 0.00 ug |
| Lutein + zeaxanthin | 648 ug |
| Vitamin E (alpha-tocopherol) | 1.9 mg |
| Vitamin E, added | 0.00 mg |
| Vitamin D (D2 + D3) | 2.9 ug |
| Vitamin K (phylloquinone) | 0.60 ug |
| Alcohol, ethyl | 0.00 g |
| Caffeine | 0.00 mg |
| Theobromine | 0.00 mg |
Fat & fatty acid profile (per 100g)
| Fatty acids, total saturated | 4.1 g |
| SFA 4:0 | 0.00 g |
| SFA 6:0 | 0.00 g |
| SFA 8:0 | 0.00 g |
| SFA 10:0 | 0.00 g |
| SFA 12:0 | 0.00 g |
| SFA 14:0 | 0.21 g |
| SFA 16:0 | 3.6 g |
| SFA 18:0 | 0.29 g |
| Fatty acids, total monounsaturated | 4.6 g |
| MUFA 16:1 | 1.0 g |
| MUFA 18:1 | 3.2 g |
| MUFA 20:1 | 0.31 g |
| MUFA 22:1 | 0.11 g |
| Fatty acids, total polyunsaturated | 7.4 g |
| PUFA 18:2 | 0.08 g |
| PUFA 18:3 | 0.02 g |
| PUFA 18:4 | 0.03 g |
| PUFA 20:4 | 0.51 g |
| PUFA 20:5 n-3 (EPA) | 2.7 g |
| PUFA 22:5 n-3 (DPA) | 0.23 g |
| PUFA 22:6 n-3 (DHA) | 3.8 g |
| Cholesterol | 588 mg |
Amino acid profile (per 100g)
Estimated from Fish, caviar, black and red, granular — USDA does not publish this profile for Caviar.
| Tryptophan | 0.32 g |
| Threonine | 1.3 g |
| Isoleucine | 1.0 g |
| Leucine | 2.1 g |
| Lysine | 1.8 g |
| Methionine | 0.65 g |
| Cystine | 0.45 g |
| Phenylalanine | 1.1 g |
| Tyrosine | 0.97 g |
| Valine | 1.3 g |
| Arginine | 1.6 g |
| Histidine | 0.65 g |
| Alanine | 1.7 g |
| Aspartic acid | 2.4 g |
| Glutamic acid | 3.6 g |
| Glycine | 0.74 g |
| Proline | 1.2 g |
| Serine | 1.9 g |
FAQ
What's the difference between caviar and roe?
True caviar specifically refers to the salt-cured roe from sturgeon fish. Roe is a broader term for the eggs of any fish (e.g., salmon roe, flying fish roe), which are often less expensive and have different flavors.
How should I store and serve caviar?
Keep it unopened in the coldest part of your refrigerator. Once opened, consume within a few days. Serve chilled, often on a non-reactive spoon (mother-of-pearl, bone, or plastic) to avoid metallic tastes.
Why is some caviar so expensive?
Price is driven by rarity (sturgeon populations are endangered), the specific species (Beluga is most expensive), the age of the fish, and the labor-intensive, traditional curing process.
Nutrient density (calculated · NRF9.3)
Nutrient Rich Foods index: beneficial nutrients (protein, fiber, vitamins, minerals) minus saturated fat, added sugar & sodium, per 100 kcal.
NRF9.3 index — Fulgoni, Keast & Drewnowski, 2009. Computed from USDA nutrients.
Weight-loss friendliness (composite index)
Energy density 2.64 kcal/g · 37% calories from protein · 0.0 g fiber · 0.0 g sugar per 100 g.
Composite of energy density (Rolls et al., 1999), protein & fiber satiety, minus sugar. A calculated heuristic — ranks satiety-per-calorie, not a clinical measure.
Dietary load (calculated from USDA values)
Potential renal acid load. Positive = acid-forming, negative = alkaline-forming.
Sodium-to-potassium ratio: 8.29 (lower is better — aim for ≤ 1)
Sodium:potassium per WHO potassium guidance. Computed from USDA nutrients.