

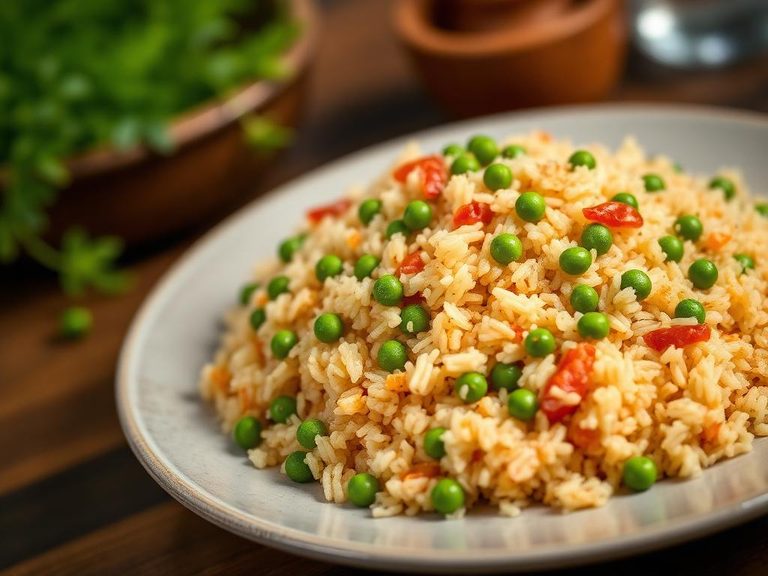
Rice, brown, with peas, fat added
Common food

Photo: Wikipedia
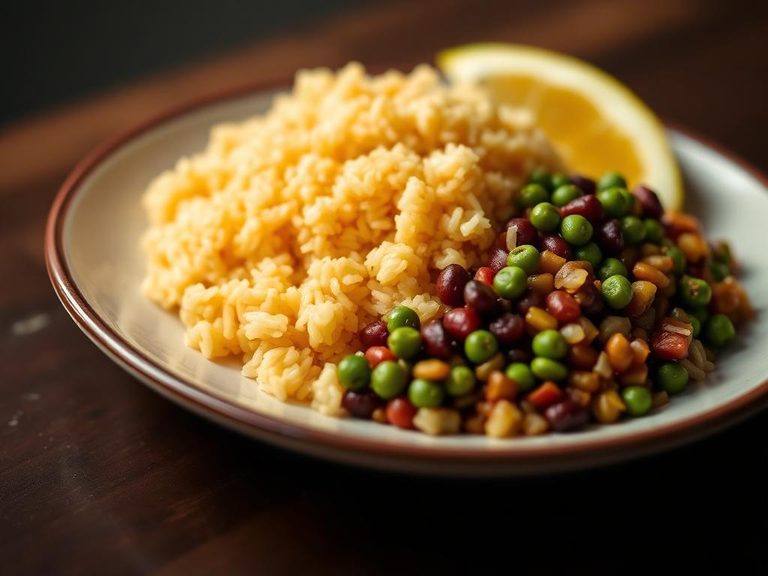
This is a comforting, earthy dish of nutty brown rice cooked with sweet green peas and a touch of added fat for richness. The texture is pleasantly chewy with pops of sweetness from the peas, while the fat helps the grains separate and adds a subtle, savory depth. Nutritionally, it provides a solid balance of complex carbohydrates and fiber with a modest protein boost from the peas.
Calorie split: 10% protein · 71% carbs · 19% fat
↓ Full nutrition💚 Why it's loved
People love it for its comforting, home-cooked appeal and the satisfying contrast between the chewy rice and sweet peas. It’s a beloved staple in many cultures, serving as a simple yet flavorful base for curries, stews, or grilled proteins.
⚠️ Watch-outs & how to enjoy it better
Some may find the texture of brown rice less appealing than white rice, and the added fat can increase calorie density. For those monitoring blood sugar, the carbohydrate content is significant; pairing it with a lean protein or non-starchy vegetables can help moderate the glycemic impact.
Key benefits
- Provides sustained energy from complex carbohydrates and fiber.
- Offers plant-based protein from the combination of rice and peas.
- Contains essential minerals like magnesium and phosphorus from brown rice.
- The fiber content supports digestive health and promotes satiety.
- A versatile, budget-friendly side dish that complements many cuisines.
🍽️ Popular dishes
🌍 Where it's eaten
💡 Did you know?
In Jamaica, 'Rice and Peas' traditionally uses kidney beans (called 'peas') and is a Sunday staple, often cooked with coconut milk for a rich, aromatic flavor.
Full nutrition (USDA data · scales with serving)
| Water | 70.6 g |
| Energy | 127 kcal |
| Protein | 3.2 g |
| Total lipid (fat) | 2.6 g |
| Carbohydrate, by difference | 22.6 g |
| Fiber, total dietary | 2.2 g |
| Total Sugars | 1.1 g |
| Calcium, Ca | 8.0 mg |
| Iron, Fe | 0.75 mg |
| Magnesium, Mg | 35.0 mg |
| Phosphorus, P | 95.0 mg |
| Potassium, K | 89.0 mg |
| Sodium, Na | 171 mg |
| Zinc, Zn | 0.69 mg |
| Copper, Cu | 0.10 mg |
| Selenium, Se | 4.7 ug |
| Vitamin C, total ascorbic acid | 2.1 mg |
| Thiamin | 0.20 mg |
| Riboflavin | 0.07 mg |
| Niacin | 2.3 mg |
| Vitamin B-6 | 0.12 mg |
| Folate, total | 19.0 ug |
| Folic acid | 0.00 ug |
| Folate, food | 19.0 ug |
| Folate, DFE | 19.0 ug |
| Choline, total | 12.8 mg |
| Vitamin B-12 | 0.00 ug |
| Vitamin B-12, added | 0.00 ug |
| Vitamin A, RAE | 22.0 ug |
| Retinol | 0.00 ug |
| Carotene, beta | 261 ug |
| Carotene, alpha | 4.0 ug |
| Cryptoxanthin, beta | 0.00 ug |
| Lycopene | 0.00 ug |
| Lutein + zeaxanthin | 501 ug |
| Vitamin E (alpha-tocopherol) | 0.49 mg |
| Vitamin E, added | 0.00 mg |
| Vitamin D (D2 + D3) | 0.00 ug |
| Vitamin K (phylloquinone) | 7.0 ug |
| Alcohol, ethyl | 0.00 g |
| Caffeine | 0.00 mg |
| Theobromine | 0.00 mg |
Fat & fatty acid profile (per 100g)
| Fatty acids, total saturated | 0.46 g |
| SFA 4:0 | 0.00 g |
| SFA 6:0 | 0.00 g |
| SFA 8:0 | 0.00 g |
| SFA 10:0 | 0.01 g |
| SFA 12:0 | 0.00 g |
| SFA 14:0 | 0.01 g |
| SFA 16:0 | 0.34 g |
| SFA 18:0 | 0.07 g |
| Fatty acids, total monounsaturated | 1.1 g |
| MUFA 16:1 | 0.01 g |
| MUFA 18:1 | 1.0 g |
| MUFA 20:1 | 0.01 g |
| MUFA 22:1 | 0.00 g |
| Fatty acids, total polyunsaturated | 1.0 g |
| PUFA 18:2 | 0.92 g |
| PUFA 18:3 | 0.09 g |
| PUFA 18:4 | 0.00 g |
| PUFA 20:4 | 0.00 g |
| PUFA 20:5 n-3 (EPA) | 0.00 g |
| PUFA 22:5 n-3 (DPA) | 0.00 g |
| PUFA 22:6 n-3 (DHA) | 0.00 g |
| Cholesterol | 0.00 mg |
Amino acid profile (per 100g)
Estimated from Snacks, rice cakes, brown rice, sesame seed — USDA does not publish this profile for Rice.
| Tryptophan | 0.10 g |
| Threonine | 0.28 g |
| Isoleucine | 0.32 g |
| Leucine | 0.63 g |
| Lysine | 0.29 g |
| Methionine | 0.17 g |
| Cystine | 0.09 g |
| Phenylalanine | 0.39 g |
| Tyrosine | 0.29 g |
| Valine | 0.44 g |
| Arginine | 0.59 g |
| Histidine | 0.19 g |
| Alanine | 0.44 g |
| Aspartic acid | 0.71 g |
| Glutamic acid | 1.6 g |
| Glycine | 0.38 g |
| Proline | 0.35 g |
| Serine | 0.39 g |
FAQ
Is this dish gluten-free?
Yes, brown rice and peas are naturally gluten-free, making this a safe option for those with celiac disease or gluten sensitivity.
Can I make it without added fat?
Yes, you can cook the rice and peas with water or broth instead of adding fat, though the texture may be slightly less rich and the grains may stick together more.
How does the fiber in brown rice compare to white rice?
Brown rice has about three times more fiber than white rice, which helps slow digestion and provides a more sustained energy release.
Nutrient density (calculated · NRF9.3)
Nutrient Rich Foods index: beneficial nutrients (protein, fiber, vitamins, minerals) minus saturated fat, added sugar & sodium, per 100 kcal.
NRF9.3 index — Fulgoni, Keast & Drewnowski, 2009. Computed from USDA nutrients.
Weight-loss friendliness (composite index)
Energy density 1.27 kcal/g · 10% calories from protein · 2.2 g fiber · 1.1 g sugar per 100 g.
Composite of energy density (Rolls et al., 1999), protein & fiber satiety, minus sugar. A calculated heuristic — ranks satiety-per-calorie, not a clinical measure.
Dietary load (calculated from USDA values)
Potential renal acid load. Positive = acid-forming, negative = alkaline-forming.
Sodium-to-potassium ratio: 1.92 (lower is better — aim for ≤ 1)
Sodium:potassium per WHO potassium guidance. Computed from USDA nutrients.