

Grape juice, purple, with added vitamin C, from concentrate, shelf stable
Whole food · Fruits and Fruit Juices
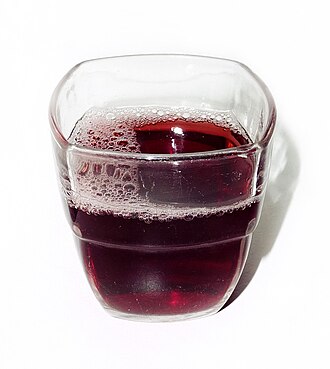
Photo: Wikipedia
This is a vibrant, deep-purple beverage made from concentrated grape juice, fortified with vitamin C for a tangy, sweet punch. Its texture is smooth and fluid, offering a refreshing, fruit-forward experience without the pulp. Nutritionally, it delivers a quick source of carbohydrates for energy, with the added benefit of antioxidant-rich vitamin C.
Calorie split: 2% protein · 95% carbs · 4% fat
↓ Full nutrition💚 Why it's loved
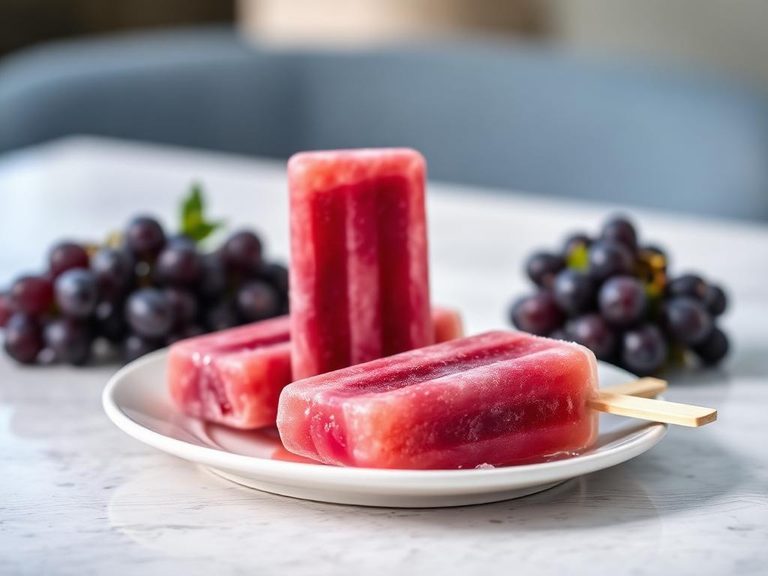
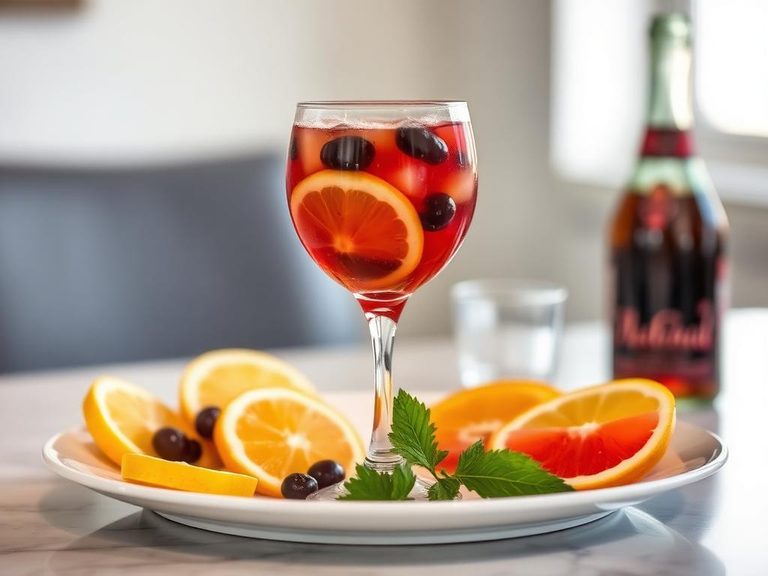
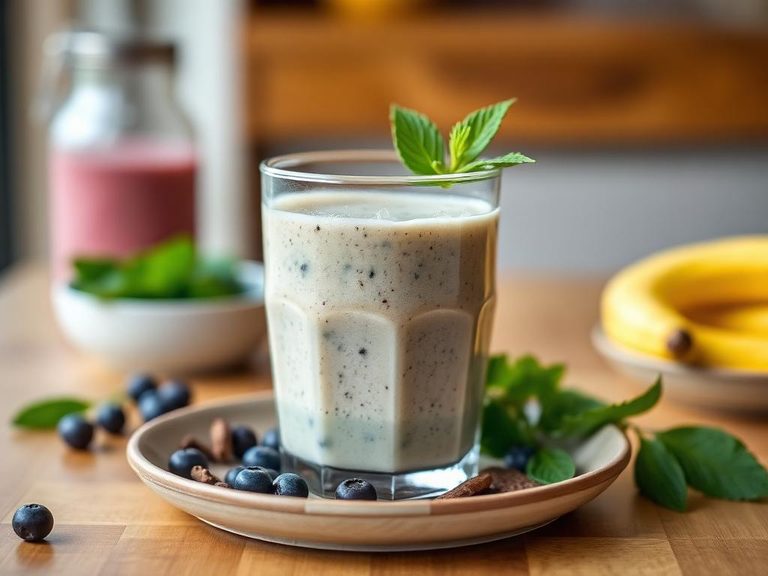
People love it for its intense, sweet-tart grape flavor that's both nostalgic and refreshing, reminiscent of classic childhood drinks. It's incredibly versatile, serving as a standalone beverage, a mixer for cocktails, or a base for smoothies and popsicles.
⚠️ Watch-outs & how to enjoy it better
The high concentration of natural sugars (about 15.6g per 100g) can lead to rapid blood-sugar spikes, making it less suitable for those managing diabetes or insulin resistance. To counteract this, pair it with a source of protein or healthy fat (like nuts or yogurt) to slow sugar absorption, and practice strict portion control, limiting intake to 4-6 oz at a time.
Key benefits
- Provides a quick source of energy from natural fruit carbohydrates.
- Fortified with vitamin C, an antioxidant that supports immune function.
- Contains natural polyphenols from purple grapes, which may support heart health.
- Convenient, shelf-stable, and ready to drink with no preparation needed.
- A good source of hydration for those who prefer flavored beverages over water.
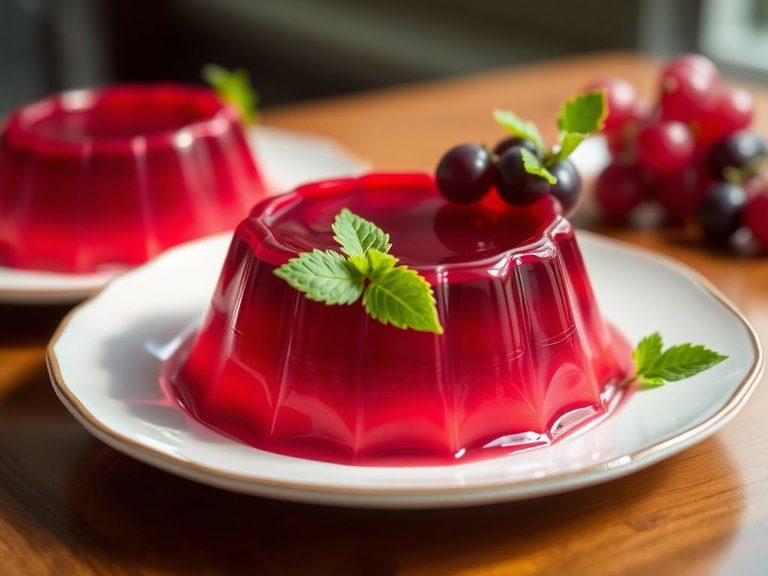
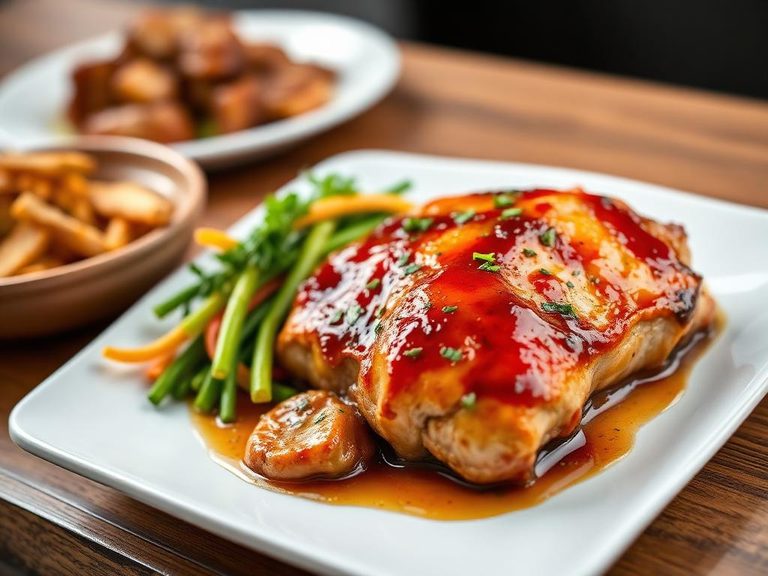
🍽️ Popular dishes
🌍 Where it's eaten
💡 Did you know?
The deep purple color of this juice comes from anthocyanins, powerful antioxidants that are also responsible for the color of blueberries and red cabbage.
Full nutrition (USDA data · scales with serving)
| Water | 83.7 g |
| Energy (Atwater General Factors) | 66.1 kcal |
| Energy (Atwater Specific Factors) | 64.5 kcal |
| Nitrogen | 0.04 g |
| Protein | 0.26 g |
| Total lipid (fat) | 0.29 g |
| Ash | 0.12 g |
| Carbohydrate, by difference | 15.6 g |
| Sugars, Total | 14.0 g |
| Sucrose | 0.00 g |
| Glucose | 6.6 g |
| Fructose | 7.4 g |
| Lactose | 0.00 g |
| Maltose | 0.00 g |
| Galactose | 0.00 g |
| Citric acid | 110 mg |
| Malic acid | 228 mg |
| Oxalic acid | 0.00 mg |
| Quinic acid | 0.00 mg |
| Calcium, Ca | 9.7 mg |
| Iron, Fe | 0.04 mg |
| Magnesium, Mg | 7.9 mg |
| Phosphorus, P | 11.9 mg |
| Potassium, K | 49.8 mg |
| Sodium, Na | 4.0 mg |
| Zinc, Zn | 0.06 mg |
| Copper, Cu | 0.01 mg |
| Manganese, Mn | 0.17 mg |
| Vitamin C, total ascorbic acid | 45.6 mg |
| Thiamin | 0.03 mg |
| Niacin | 0.02 mg |
| Vitamin B-6 | 0.04 mg |
| Folate, total | 0.66 ug |
Fat & fatty acid profile (per 100g)
Estimated from Grapefruit, sections, canned, juice pack, solids and liquids — USDA does not publish this profile for Grape juice.
| Fatty acids, total saturated | 0.01 g |
| SFA 4:0 | 0.00 g |
| SFA 6:0 | 0.00 g |
| SFA 8:0 | 0.00 g |
| SFA 10:0 | 0.00 g |
| SFA 12:0 | 0.00 g |
| SFA 14:0 | 0.00 g |
| SFA 16:0 | 0.01 g |
| SFA 18:0 | 0.00 g |
| Fatty acids, total monounsaturated | 0.01 g |
| MUFA 16:1 | 0.00 g |
| MUFA 18:1 | 0.01 g |
| MUFA 20:1 | 0.00 g |
| MUFA 22:1 | 0.00 g |
| Fatty acids, total polyunsaturated | 0.02 g |
| PUFA 18:2 | 0.02 g |
| PUFA 18:3 | 0.00 g |
| PUFA 18:4 | 0.00 g |
| PUFA 20:4 | 0.00 g |
| PUFA 20:5 n-3 (EPA) | 0.00 g |
| PUFA 22:5 n-3 (DPA) | 0.00 g |
| PUFA 22:6 n-3 (DHA) | 0.00 g |
| Fatty acids, total trans | 0.00 g |
| Cholesterol | 0.00 mg |
Amino acid profile (per 100g)
Estimated from Grapefruit, sections, canned, juice pack, solids and liquids — USDA does not publish this profile for Grape juice.
| Tryptophan | 0.01 g |
| Threonine | 0.01 g |
| Isoleucine | 0.01 g |
| Leucine | 0.01 g |
| Lysine | 0.02 g |
| Methionine | 0.01 g |
| Cystine | 0.01 g |
| Phenylalanine | 0.04 g |
| Tyrosine | 0.01 g |
| Valine | 0.01 g |
| Arginine | 0.08 g |
| Histidine | 0.01 g |
| Alanine | 0.02 g |
| Aspartic acid | 0.13 g |
| Glutamic acid | 0.18 g |
| Glycine | 0.01 g |
| Proline | 0.06 g |
| Serine | 0.03 g |
FAQ
Is this juice the same as eating whole grapes?
No, this juice lacks the dietary fiber found in whole grapes, which helps slow sugar absorption and promotes fullness. The juicing process also concentrates the sugars.
Why is vitamin C added?
Vitamin C is added as a preservative to prevent oxidation and browning, and also to boost the nutritional profile with an antioxidant that supports immune health.
Can I use this in baking?
Yes, it can be used in cakes, muffins, or glazes to add a concentrated grape flavor and moisture, though you may need to adjust other liquids in the recipe.
Nutrient density (calculated · NRF9.3)
Nutrient Rich Foods index: beneficial nutrients (protein, fiber, vitamins, minerals) minus saturated fat, added sugar & sodium, per 100 kcal.
NRF9.3 index — Fulgoni, Keast & Drewnowski, 2009. Computed from USDA nutrients.
Weight-loss friendliness (composite index)
Energy density 0.66 kcal/g · 2% calories from protein · 0.0 g fiber · 0.0 g sugar per 100 g.
Composite of energy density (Rolls et al., 1999), protein & fiber satiety, minus sugar. A calculated heuristic — ranks satiety-per-calorie, not a clinical measure.
Dietary load (calculated from USDA values)
Potential renal acid load. Positive = acid-forming, negative = alkaline-forming.
Sodium-to-potassium ratio: 0.08 (lower is better — aim for ≤ 1)
Sodium:potassium per WHO potassium guidance. Computed from USDA nutrients.