

Cookie, vanilla wafer, reduced fat
Common food

Photo: Wikipedia
A light, crisp, and buttery biscuit with a delicate sweetness, the reduced-fat vanilla wafer offers a satisfying crunch with fewer calories than its full-fat counterpart. Its pale golden color and simple flavor make it a versatile staple in both snacking and dessert-making. Nutritionally, it is a carbohydrate-heavy treat with significant sugar content, providing quick energy but little protein or fiber.
Calorie split: 4% protein · 65% carbs · 30% fat
↓ Full nutrition💚 Why it's loved
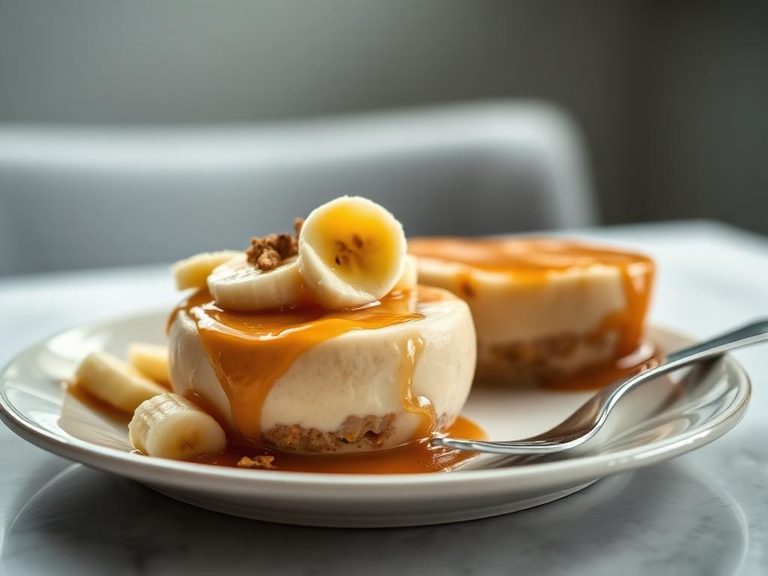
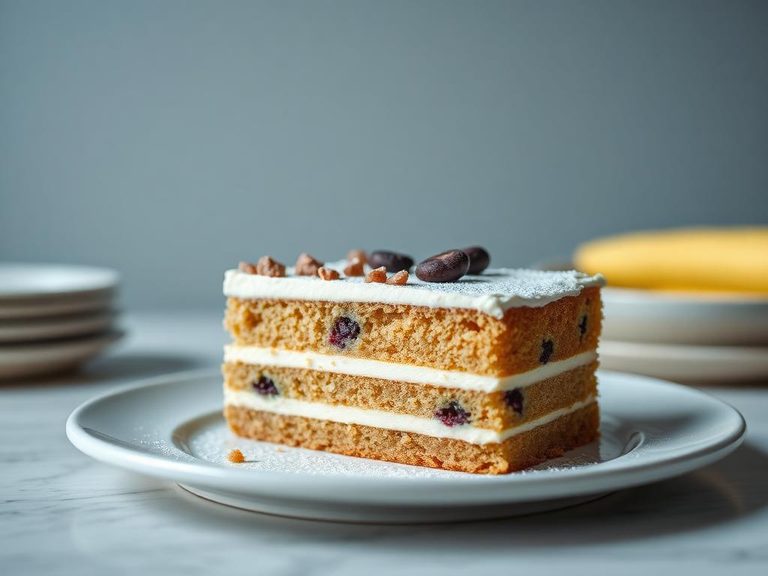
People love these wafers for their simple, nostalgic sweetness and the way they soften perfectly when layered with pudding or bananas, creating a classic dessert texture. Their mild vanilla flavor and crisp bite make them an easy, crowd-pleasing snack or baking component.
⚠️ Watch-outs & how to enjoy it better
The high sugar content (37.5g per 100g) can cause blood-sugar spikes, and the low fiber and protein mean they offer little satiety, potentially leading to overeating. To counteract this, pair them with a source of protein or fat like Greek yogurt, nut butter, or a handful of nuts, and practice strict portion control by measuring servings rather than eating from the box.
Key benefits
- Lower in fat than traditional vanilla wafers
- Provides a quick source of energy from carbohydrates
- Light and crispy texture is satisfying for snacking
- Versatile ingredient for no-bake desserts and crusts
- Often lower in calories per serving than full-fat versions
🍽️ Popular dishes

🌍 Where it's eaten
💡 Did you know?
The Nilla Wafer brand name is a shortened form of 'vanilla wafer,' and the iconic cookie has been a staple in American pantries since the early 20th century, originally produced by Nabisco.
Full nutrition (USDA data · scales with serving)
| Water | 5.1 g |
| Energy | 441 kcal |
| Protein | 5.0 g |
| Total lipid (fat) | 15.2 g |
| Carbohydrate, by difference | 73.6 g |
| Fiber, total dietary | 1.9 g |
| Total Sugars | 37.5 g |
| Calcium, Ca | 48.0 mg |
| Iron, Fe | 2.4 mg |
| Magnesium, Mg | 14.0 mg |
| Phosphorus, P | 104 mg |
| Potassium, K | 97.0 mg |
| Sodium, Na | 388 mg |
| Zinc, Zn | 0.36 mg |
| Copper, Cu | 0.10 mg |
| Selenium, Se | 11.3 ug |
| Vitamin C, total ascorbic acid | 0.00 mg |
| Thiamin | 0.28 mg |
| Riboflavin | 0.32 mg |
| Niacin | 3.1 mg |
| Vitamin B-6 | 0.07 mg |
| Folate, total | 60.0 ug |
| Folic acid | 51.0 ug |
| Folate, food | 9.0 ug |
| Folate, DFE | 96.0 ug |
| Choline, total | 27.6 mg |
| Vitamin B-12 | 0.13 ug |
| Vitamin B-12, added | 0.00 ug |
| Vitamin A, RAE | 8.0 ug |
| Retinol | 8.0 ug |
| Carotene, beta | 1.0 ug |
| Carotene, alpha | 0.00 ug |
| Cryptoxanthin, beta | 1.0 ug |
| Lycopene | 0.00 ug |
| Lutein + zeaxanthin | 41.0 ug |
| Vitamin E (alpha-tocopherol) | 0.23 mg |
| Vitamin E, added | 0.00 mg |
| Vitamin D (D2 + D3) | 0.00 ug |
| Vitamin K (phylloquinone) | 6.0 ug |
| Alcohol, ethyl | 0.00 g |
| Caffeine | 0.00 mg |
| Theobromine | 0.00 mg |
Fat & fatty acid profile (per 100g)
| Fatty acids, total saturated | 3.8 g |
| SFA 4:0 | 0.00 g |
| SFA 6:0 | 0.00 g |
| SFA 8:0 | 0.00 g |
| SFA 10:0 | 0.00 g |
| SFA 12:0 | 0.00 g |
| SFA 14:0 | 0.06 g |
| SFA 16:0 | 2.2 g |
| SFA 18:0 | 1.5 g |
| Fatty acids, total monounsaturated | 6.5 g |
| MUFA 16:1 | 0.03 g |
| MUFA 18:1 | 6.5 g |
| MUFA 20:1 | 0.00 g |
| MUFA 22:1 | 0.00 g |
| Fatty acids, total polyunsaturated | 3.9 g |
| PUFA 18:2 | 3.6 g |
| PUFA 18:3 | 0.23 g |
| PUFA 18:4 | 0.00 g |
| PUFA 20:4 | 0.02 g |
| PUFA 20:5 n-3 (EPA) | 0.01 g |
| PUFA 22:5 n-3 (DPA) | 0.00 g |
| PUFA 22:6 n-3 (DHA) | 0.01 g |
| Cholesterol | 51.0 mg |
Amino acid profile (per 100g)
Estimated from Pie Crust, Cookie-type, Chocolate, Ready Crust — USDA does not publish this profile for Cookie.
| Tryptophan | 0.08 g |
| Threonine | 0.20 g |
| Isoleucine | 0.23 g |
| Leucine | 0.38 g |
| Lysine | 0.24 g |
| Methionine | 0.07 g |
| Cystine | 0.11 g |
| Phenylalanine | 0.28 g |
| Tyrosine | 0.16 g |
| Valine | 0.32 g |
| Arginine | 0.29 g |
| Histidine | 0.11 g |
| Alanine | 0.24 g |
| Aspartic acid | 0.45 g |
| Glutamic acid | 1.3 g |
| Glycine | 0.24 g |
| Proline | 0.42 g |
| Serine | 0.26 g |
FAQ
How does the reduced-fat version compare nutritionally to the regular version?
The reduced-fat version typically has fewer calories and less fat per serving, but often compensates with a similar or even higher sugar content to maintain flavor and texture. Always check the label for specific differences.
Can I use these wafers in place of regular vanilla wafers in recipes?
Yes, they can generally be used as a 1:1 substitute in most recipes like banana pudding or cheesecake crusts. However, their slightly different texture and lower fat content may affect the final richness and mouthfeel.
Are these wafers suitable for a low-carb or diabetic diet?
No, they are high in carbohydrates and sugar, making them unsuitable for low-carb or diabetic diets without significant portion control and pairing with protein or fat to mitigate blood sugar impact.
Nutrient density (calculated · NRF9.3)
Nutrient Rich Foods index: beneficial nutrients (protein, fiber, vitamins, minerals) minus saturated fat, added sugar & sodium, per 100 kcal.
NRF9.3 index — Fulgoni, Keast & Drewnowski, 2009. Computed from USDA nutrients.
Weight-loss friendliness (composite index)
Energy density 4.41 kcal/g · 5% calories from protein · 1.9 g fiber · 37.5 g sugar per 100 g.
Composite of energy density (Rolls et al., 1999), protein & fiber satiety, minus sugar. A calculated heuristic — ranks satiety-per-calorie, not a clinical measure.
Dietary load (calculated from USDA values)
Potential renal acid load. Positive = acid-forming, negative = alkaline-forming.
Sodium-to-potassium ratio: 4.00 (lower is better — aim for ≤ 1)
Sodium:potassium per WHO potassium guidance. Computed from USDA nutrients.