

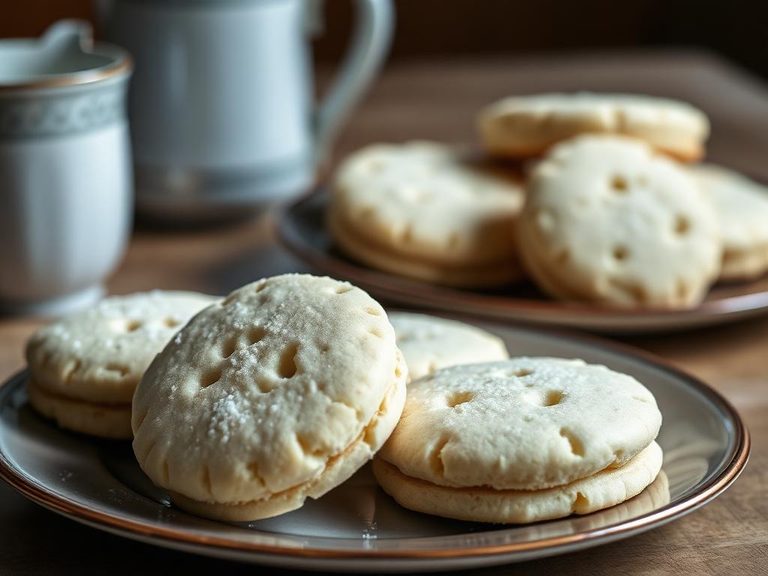
Cookie, shortbread, with icing or filling
Common food

Photo: Wikipedia
A rich, crumbly butter biscuit, often layered with a sweet icing or a jam filling. It delivers a satisfying, melt-in-the-mouth texture with a pronounced buttery flavor, balanced by the sweetness of its topping. Nutritionally, it is a dense energy source, high in fat and sugar, with minimal protein or fiber.
Calorie split: 4% protein · 48% carbs · 48% fat
↓ Full nutrition💚 Why it's loved
People love it for its buttery, melt-in-your-mouth texture and the sweet contrast of icing or jam. It's a classic comfort food, often associated with afternoon tea and nostalgic treats.
⚠️ Watch-outs & how to enjoy it better
The high sugar and fat content can lead to blood-sugar spikes and is not ideal for those monitoring caloric intake. To counteract this, pair a small portion with a source of protein or healthy fat (like nuts or cheese) to slow digestion, and practice strict portion control. Those with gluten or dairy allergies should avoid it.
Key benefits
- Provides a quick source of energy from carbohydrates and fats
- Offers a satisfying, indulgent treat for special occasions
- The buttery flavor is a classic, comforting taste profile
- Can be paired with tea or coffee for a traditional snack
🍽️ Popular dishes
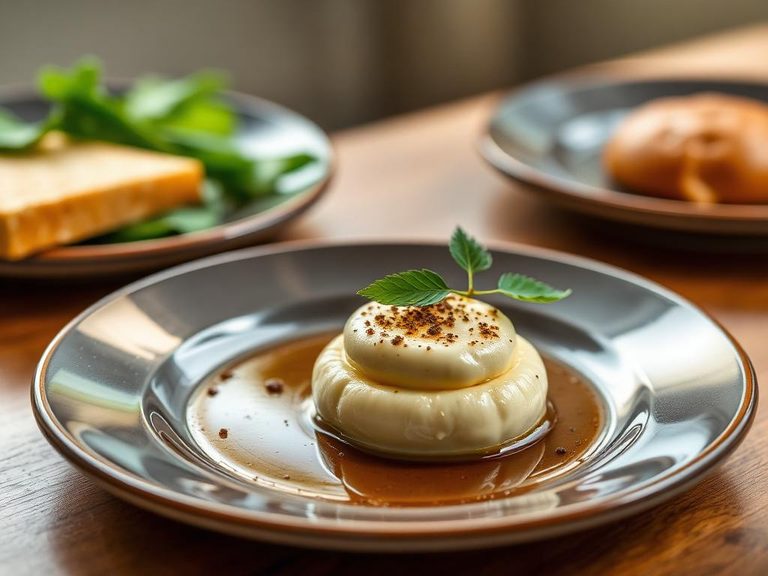
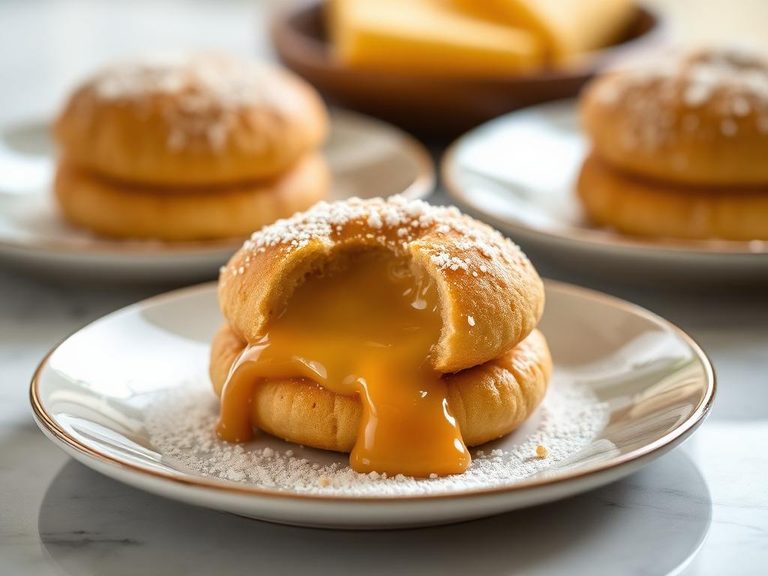
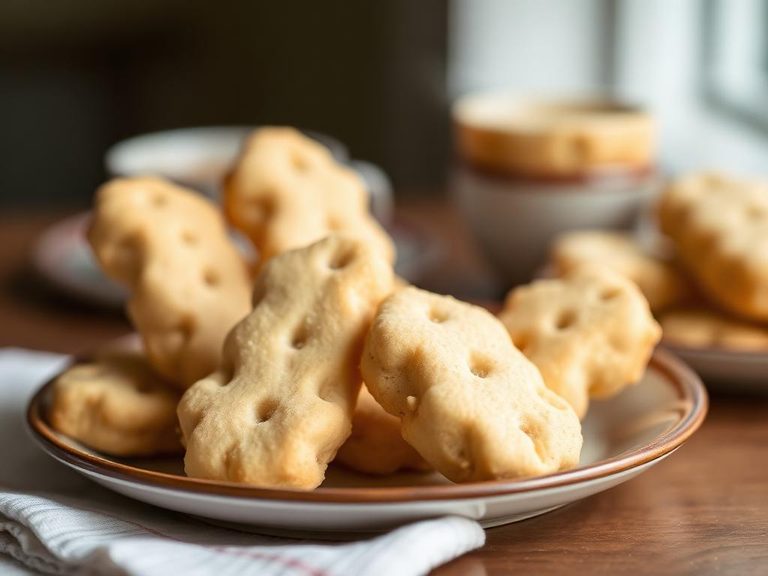
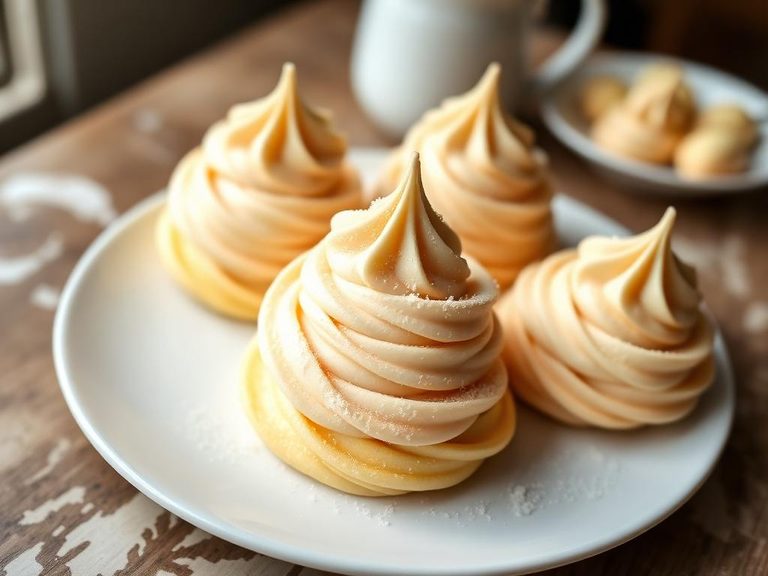
🌍 Where it's eaten
💡 Did you know?
Traditional Scottish shortbread was historically a luxury item, often served only at special occasions like weddings and Christmas, and was originally made with just three ingredients: butter, sugar, and oat flour.
Full nutrition (USDA data · scales with serving)
| Water | 3.0 g |
| Energy | 515 kcal |
| Protein | 5.0 g |
| Total lipid (fat) | 28.3 g |
| Carbohydrate, by difference | 62.6 g |
| Fiber, total dietary | 2.1 g |
| Total Sugars | 27.3 g |
| Calcium, Ca | 16.0 mg |
| Iron, Fe | 3.0 mg |
| Magnesium, Mg | 32.0 mg |
| Phosphorus, P | 77.0 mg |
| Potassium, K | 138 mg |
| Sodium, Na | 283 mg |
| Zinc, Zn | 0.69 mg |
| Copper, Cu | 0.20 mg |
| Selenium, Se | 5.7 ug |
| Vitamin C, total ascorbic acid | 0.00 mg |
| Thiamin | 0.29 mg |
| Riboflavin | 0.27 mg |
| Niacin | 2.7 mg |
| Vitamin B-6 | 0.06 mg |
| Folate, total | 67.0 ug |
| Folic acid | 49.0 ug |
| Folate, food | 18.0 ug |
| Folate, DFE | 101 ug |
| Choline, total | 4.8 mg |
| Vitamin B-12 | 0.00 ug |
| Vitamin B-12, added | 0.00 ug |
| Vitamin A, RAE | 0.00 ug |
| Retinol | 0.00 ug |
| Carotene, beta | 1.0 ug |
| Carotene, alpha | 0.00 ug |
| Cryptoxanthin, beta | 0.00 ug |
| Lycopene | 0.00 ug |
| Lutein + zeaxanthin | 26.0 ug |
| Vitamin E (alpha-tocopherol) | 2.1 mg |
| Vitamin E, added | 0.00 mg |
| Vitamin D (D2 + D3) | 0.00 ug |
| Vitamin K (phylloquinone) | 10.8 ug |
| Alcohol, ethyl | 0.00 g |
| Caffeine | 12.0 mg |
| Theobromine | 90.0 mg |
Fat & fatty acid profile (per 100g)
| Fatty acids, total saturated | 10.2 g |
| SFA 4:0 | 0.07 g |
| SFA 6:0 | 0.05 g |
| SFA 8:0 | 0.03 g |
| SFA 10:0 | 0.08 g |
| SFA 12:0 | 0.10 g |
| SFA 14:0 | 0.37 g |
| SFA 16:0 | 5.7 g |
| SFA 18:0 | 3.5 g |
| Fatty acids, total monounsaturated | 8.0 g |
| MUFA 16:1 | 0.08 g |
| MUFA 18:1 | 7.8 g |
| MUFA 20:1 | 0.04 g |
| MUFA 22:1 | 0.00 g |
| Fatty acids, total polyunsaturated | 7.3 g |
| PUFA 18:2 | 6.5 g |
| PUFA 18:3 | 0.78 g |
| PUFA 18:4 | 0.00 g |
| PUFA 20:4 | 0.01 g |
| PUFA 20:5 n-3 (EPA) | 0.00 g |
| PUFA 22:5 n-3 (DPA) | 0.00 g |
| PUFA 22:6 n-3 (DHA) | 0.00 g |
| Cholesterol | 0.00 mg |
Amino acid profile (per 100g)
Estimated from Pie Crust, Cookie-type, Chocolate, Ready Crust — USDA does not publish this profile for Cookie.
| Tryptophan | 0.08 g |
| Threonine | 0.20 g |
| Isoleucine | 0.23 g |
| Leucine | 0.38 g |
| Lysine | 0.24 g |
| Methionine | 0.07 g |
| Cystine | 0.11 g |
| Phenylalanine | 0.28 g |
| Tyrosine | 0.16 g |
| Valine | 0.32 g |
| Arginine | 0.29 g |
| Histidine | 0.11 g |
| Alanine | 0.24 g |
| Aspartic acid | 0.45 g |
| Glutamic acid | 1.3 g |
| Glycine | 0.24 g |
| Proline | 0.42 g |
| Serine | 0.26 g |
FAQ
What is the difference between shortbread and a regular cookie?
Shortbread has a higher ratio of butter to flour, giving it a crumbly, 'short' texture, whereas regular cookies often use more leavening agents and have a chewier or crispier texture.
Is shortbread with icing suitable for a diabetic diet?
Due to its high sugar and refined carbohydrate content, it is generally not recommended for diabetics without careful portion control and blood sugar monitoring.
Can I make a healthier version of this cookie?
You can reduce sugar, use whole wheat flour, or substitute some butter with coconut oil, but the texture and flavor will change significantly from the traditional recipe.
Nutrient density (calculated · NRF9.3)
Nutrient Rich Foods index: beneficial nutrients (protein, fiber, vitamins, minerals) minus saturated fat, added sugar & sodium, per 100 kcal.
NRF9.3 index — Fulgoni, Keast & Drewnowski, 2009. Computed from USDA nutrients.
Weight-loss friendliness (composite index)
Energy density 5.15 kcal/g · 4% calories from protein · 2.1 g fiber · 27.3 g sugar per 100 g.
Composite of energy density (Rolls et al., 1999), protein & fiber satiety, minus sugar. A calculated heuristic — ranks satiety-per-calorie, not a clinical measure.
Dietary load (calculated from USDA values)
Potential renal acid load. Positive = acid-forming, negative = alkaline-forming.
Sodium-to-potassium ratio: 2.05 (lower is better — aim for ≤ 1)
Sodium:potassium per WHO potassium guidance. Computed from USDA nutrients.